 Scoop has an Ethical Paywall


NIWA Outlook: June-August 2015
NIWA Outlook: June-August 2015
Overview
An El Niño event is now under way in the tropical Pacific. In the second half of May, the Pacific trade winds weakened substantially and the Southern Oscillation Index (SOI) dropped below -1, indicating coupling had been achieved between the warmer sea surface temperatures and the overlying atmospheric circulation.
International guidance indicates that El Niño conditions are very likely (90% chance) to continue over the next three months period (June – August 2015). The likelihood of El Niño persisting or strengthening as we reach into spring is also very high (above 80%).
During June – August 2015, above normal pressure is forecast to the west of New Zealand, while below normal pressure is expected to the northeast of the country. This circulation pattern is likely to be accompanied with anomalous westerly to southwesterly wind flows.
Sea surface temperatures for the coming three months are expected to be near average around the coasts of New Zealand.
Outlook Summary
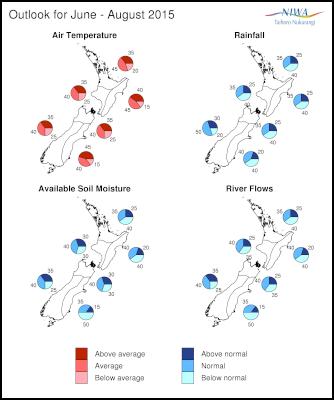
June – August 2015 temperatures are about equally likely (35 to 45% chance) to be average or above average in all regions of New Zealand except in the north of the North Island, where temperatures for the next three months as a whole are most likely (45 % chance) to be in the near normal range. Note that cold snaps and frosts are to be expected in some parts of the country as we progress into winter.
June – August 2015 rainfall totals are about equally likely (35-40% chance) to be in the near normal or below normal range for all regions of New Zealand except for the west of the South Island, where near normal rainfall is the most likely outcome (50% chance).
Soil moisture and river flow are most likely (50 % chance) to be below normal in the east of the South Island and about equally likely (35-40% chance) to below normal or near normal in the north and east of the North Island. In the west of the North Island and the north of the South Island, soil moisture levels are most likely (40 % chance) to be in the near normal range, while river flows are about equally likely (35-40% chance) to be in the near normal or below normal range. Soil moisture levels and river flows are about equally likely (35-40% chance) to be in the near normal or above normal range in the west of the South Island.
Regional predictions for the June to August season
Northland, Auckland, Waikato, Bay of Plenty
The table below shows the probabilities (or percent chances) for each of three categories: above average, near average, and below average. In the absence of any forecast guidance there would be an equal likelihood (33% chance) of the outcome being in any one of the three categories. Forecast information from local and global guidance models is used to indicate the deviation from equal chance expected for the coming three month period, with the following outcomes the most likely (but not certain) for this region:
• Temperatures are most likely (45%
chance) to be near average.
•
• Rainfall totals,
soil moisture levels and river flows are about equally
likely (35-40% chance) to be in the normal or below normal
range.
•
Other outcomes cannot be excluded. The
full probability breakdown is:
| Temperature | Rainfall | Soil moisture | River flows | |
| Above average | 35 | 25 | 25 | 25 |
| Near average | 45 | 35 | 35 | 35 |
| Below average | 20 | 40 | 40 | 40 |
Central
North Island, Taranaki, Wanganui, Manawatu,
Wellington
Probabilities are assigned in three categories: above average, near average, and below average.
• Temperatures are about equally likely (35-40% chance)
to be near or above average.
•
• Rainfall totals
and river flows are about equally likely (35-40% chance) to
be in the below normal or near normal
range.
•
• Soil moisture levels are most likely
(40% chance) to be in the near normal range.
•
The
full probability breakdown is:
| Temperature | Rainfall | Soil moisture | River flows | |
| Above average | 35 | 25 | 30 | 25 |
| Near average | 40 | 35 | 40 | 40 |
| Below average | 25 | 40 | 30 | 35 |
Gisborne,
Hawke’s Bay, Wairarapa
Probabilities are assigned in three categories: above average, near average, and below average.
• Temperatures are about equally
likely (40-45% chance) to be average or above
average.
•
• Rainfall totals are about equally
likely (35-40% chance) to be in the below normal or near
normal range.
•
• Soil moisture levels and river
flows are equally likely (40% chance) to be in the near
normal or below normal range.
•
The full
probability breakdown is:
| Temperature | Rainfall | Soil moisture | River flows | |
| Above average | 40 | 25 | 20 | 20 |
| Near average | 45 | 35 | 40 | 40 |
| Below average | 15 | 40 | 40 | 40 |
Nelson,
Marlborough, Buller
Probabilities are assigned in three categories: above average, near average, and below average.
• Temperatures are about equally likely
(35-40% chance) to be near average or above
average.
•
• Rainfall totals and river flows are
about equally likely (35-40% chance) to be in the below
normal or near normal range.
•
• Soil moisture
levels are most likely (40% chance) to be in the near normal
range.
•
The full probability breakdown is:
| Temperature | Rainfall | Soil moisture | River flows | |
| Above average | 35 | 25 | 30 | 25 |
| Near average | 40 | 35 | 40 | 40 |
| 40Below average | 25 | 40 | 30 | 35 |
West
Coast, Alps and foothills, inland Otago,
Southland
Probabilities are assigned in three categories: above average, near average, and below average.
• Temperatures are about equally likely (35-40% chance)
to be in the near average or above average
range.
•
• Rainfall totals are most likely (50%
chance) to be in the near normal range.
•
• Soil
moisture levels and river flows are about equally likely
(35-40% chance) to be in the near normal or above normal
range.
•
The full probability breakdown is:
| Temperature | Rainfall | Soil moisture | River flows | |
| Above average | 35 | 30 | 35 | 35 |
| Near average | 40 | 50 | 40 | 40 |
| Below average | 25 | 20 | 25 | 25 |
Coastal
Canterbury, east Otago
Probabilities are assigned in three categories: above average, near average, and below average.
• Temperatures are about equally likely
(40-45% chance) to be in the near average or above average
range.
•
• Rainfall totals are equally likely
(40% chance) to be in the near normal or below normal range.
•
• Soil moisture levels and river flows are
most likely (50% chance) to be in the below normal
range.
•
The full probability breakdown is:
| Temperature | Rainfall | Soil moisture | River flows | |
| Above average | 45 | 20 | 15 | 15 |
| Near average | 40 | 40 | 35 | 35 |
| Below average | 15 | 40 | 50 | 50 |
Graphical
representation of the regional probabilities
Background
El Niño conditions became established in May 2015. In the second half of May, the Pacific trade winds weakened substantially and the Southern Oscillation Index (SOI) dropped below -1, indicating coupling had been achieved between the warmer sea surface temperatures and the overlying atmospheric circulation.
Convection and rainfall anomalies along the Equator are also indicative of an active coupling between the Ocean and the Atmosphere: the Inter-Tropical Convergence Zone (ITCZ) in particular was more intense than normal around and to the east of the International Dateline, while the Maritime Continent experienced much drier conditions than normal.
Collectively these signals clearly indicate El Niño became fully established in the tropical Pacific in May of 2015.
International guidance indicates that El Niño conditions are very likely (90% chance) to continue over the next three months period (June – August 2015). The likelihood of El Niño persisting or strengthening as we reach into spring is also very high (above 80%).
Note that El Niño events are typically (but not always) associated with stronger and/or more frequent southerly winds during the winter in New Zealand. Such a circulation pattern typically leads to cooler conditions in most regions of the country. Despite the forecast for El Niño to continue over the next three months, regional atmospheric circulation is expected to present more westerlies to southwesterlies, and the temperature outlook - as synthesized from various dynamical and statistical models - indicates that average or above average temperatures are likely in most regions.
Waters surrounding New Zealand remain slightly warmer than average. Ocean models forecasts indicate that SSTs are likely to be close to normal around the country over the next three months.
To find out more about normal conditions for this outlook period, refer to NIWA’s website, where daily updates on climate maps are available.
ENDS
 REINZ: Buyer Activity Softens As Living Costs Remain A Consideration Across Key Regions
 Better Taxes for a Better Future: Tax Policy Welcome Contribution, But Missed Opportunity To Tackle Wealth Inequality
 Google Threat Intelligence Group - GTIG: Google Threat Report Warns AI-Driven Cyber Operations Are Scaling Across Global Threat Landscape
 Commerce Commission: Baseline Research Report On The State Of Competition In New Zealand
 University of Auckland: Junk Food Designed To Make Us Eat More, Study Finds
 Spark: New Report Sets Out Outcomes-Led Approach To Lift Rural Connectivity Using The Right Mix Of Technologies