https://www.scoop.co.nz/stories/BU2511/S00028/eco-pulse-following-the-people-south.htm
|
| ||
Eco-Pulse: Following The People (South) |
||
Following the people (south)
We’ve hit that time of year when we get to understand a little more of where people are going up and down the country. Stats NZ have just released their annual estimates of regional population growth.
Yes, the data are a tad backward looking (year to June 2025[1]), but they’re nonetheless important in understanding regional economic performance.
Given the highly divergent performance of the regions over the past few years, internal migration flows in particular give us a feel for how folk might be voting with their feet. People both follow economic activity and bring it with them. Follow the people!
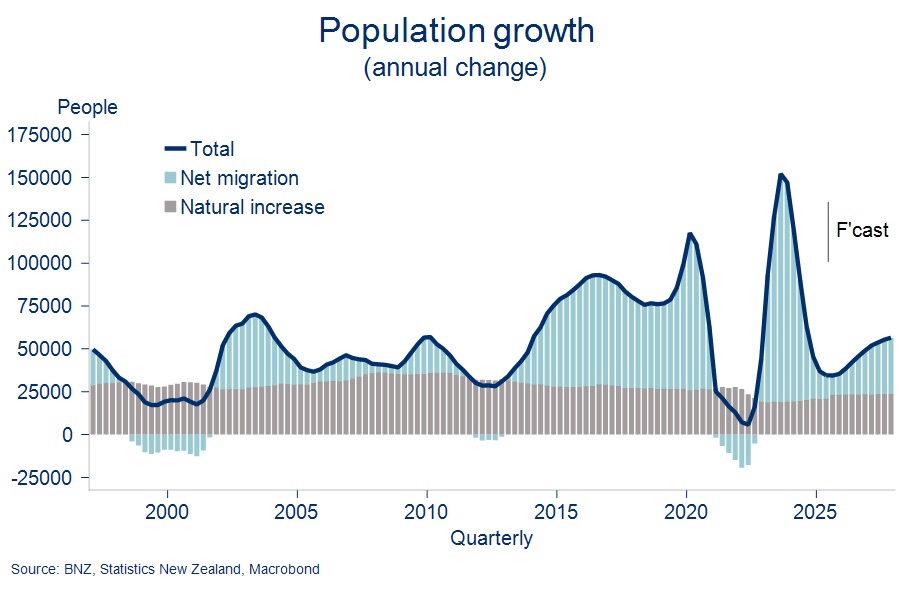
We’ve been highlighting the challenges posed for the economic recovery from falling population growth. In the year to June 2025, the resident population increased 0.7%, to 5.32 million.
That’s down from 1.7% last year and around half the long-term average. The slowing entirely reflects reduced net migration numbers. Indicative of such, the population increase attributable to natural growth (births less deaths) exceeded that of net migration in 2025 for the first time in 12 years (ex-COVID).
The chart below shows how the 2023-2025 slowing in population growth has been experienced around the regions. Auckland predictably felt it most acutely following the migration-driven outperformance of 2023 and 2024. Gisborne wasn’t far behind with population growth slumping from 1.0% in 2023 and 2024, to a 0.2% decline in 2025.
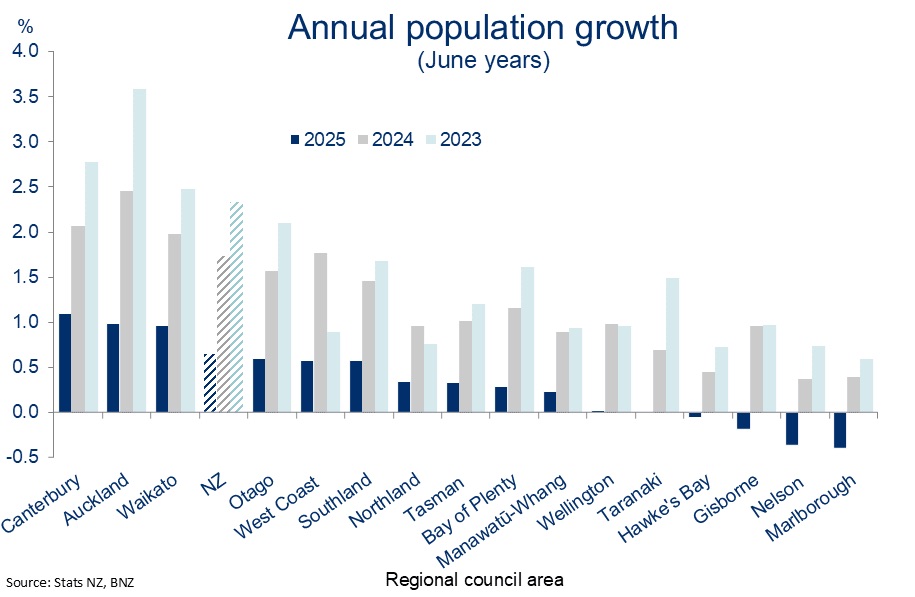
Unseating Auckland for strongest growth in 2025 was its southern counterparty Canterbury, something that will surprise few in the mainland. Population growth still slowed there but by less than elsewhere. The areas of Waimakariri, Christchurch, and particularly Selwyn (2.4% annual growth) were the largest positive contributors.
Canterbury, Waikato, and Auckland continue to experience population growth noticeably stronger than the rest of the country.
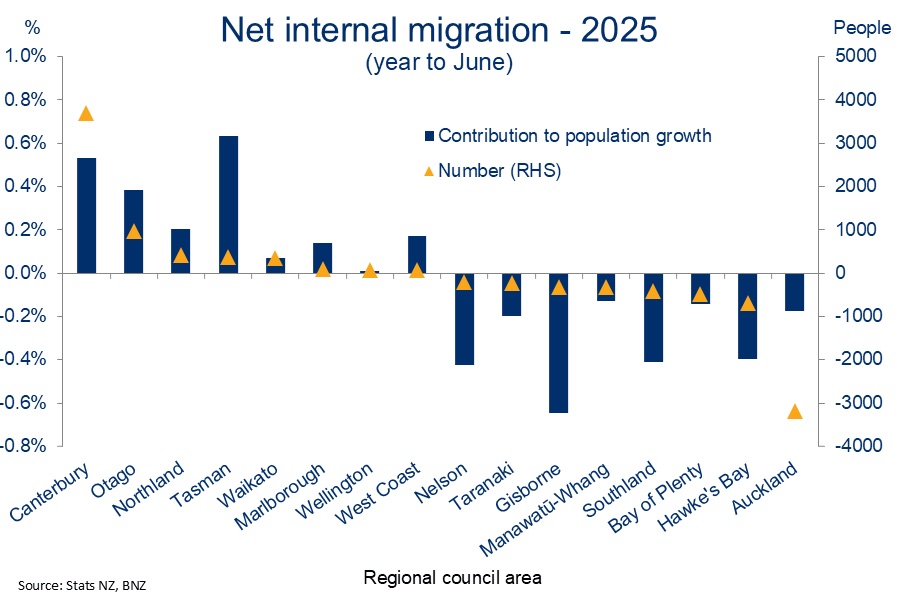
Breaking down the topline stats (chart below) shows Canterbury’s population gain was driven by solid contributions from all three sources: natural growth, and net international and internal migration. Auckland again made up for a modest internal migration “out” with the strongest natural population growth in the country and continued, albeit reduced, international migration “in”.
The populations of four regions were estimated to have contracted. The largest declines were recorded in Marlborough and Nelson, with some of the latter likely explained by relocations to Richmond (part of Tasman), just down the road. The natural disasters of recent years may also have played a role, similar to the experience of Gisborne.
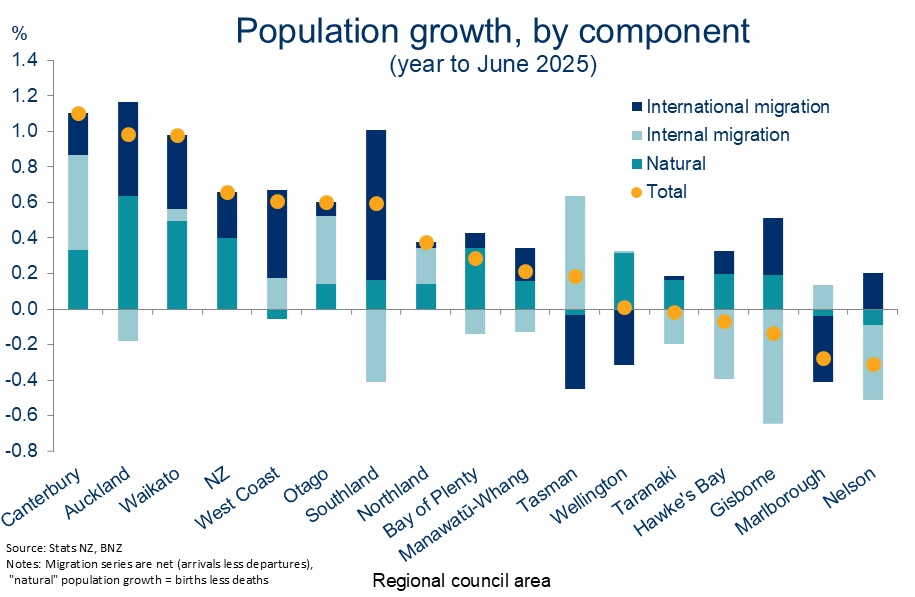
The Wellington region’s population was unchanged as natural increase exactly offset an international migration outflow of 1,700 people. Southland experienced the largest (1.3%) gross shift in its 105,000-strong population as internal and international migrants respectively left and entered the region, on net.
We’d note in passing that home building rates don’t appear to be falling behind in those regions experiencing above-average population growth. This gels with some of our previous research on housing supply.
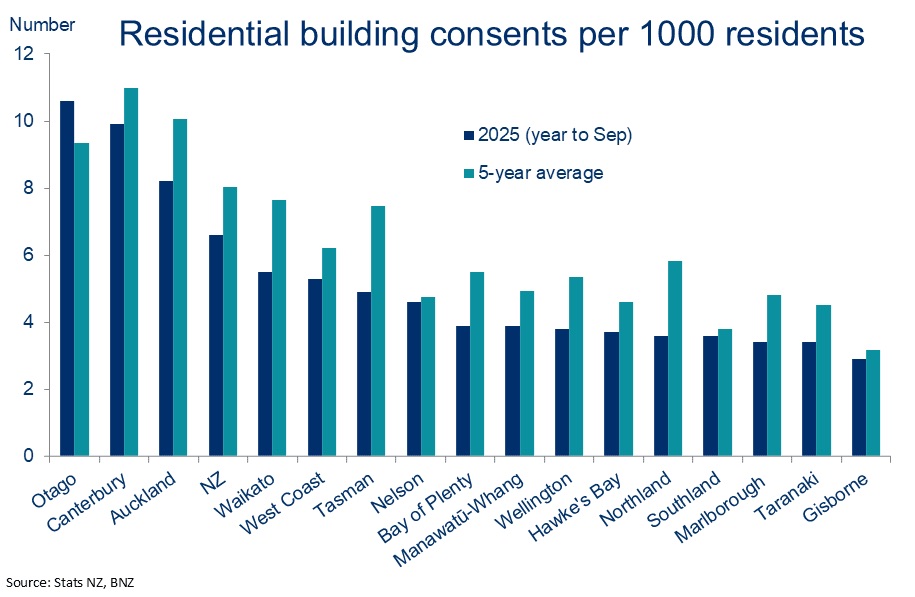
Canterbury, Auckland, Otago, and Waikato – regions that have outperformed in the population growth stakes in recent years – remain the busiest when it comes to per-capita building consent issuance (chart above).
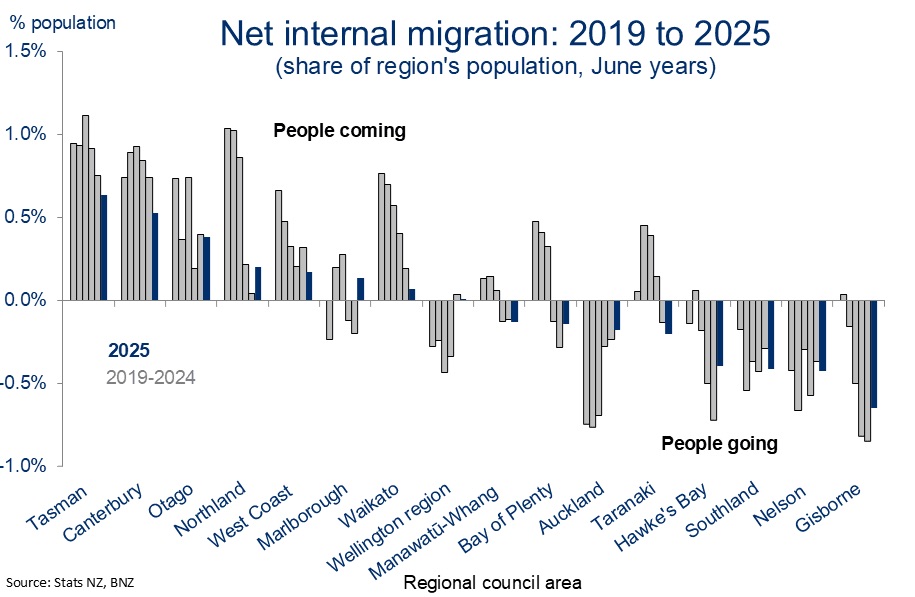
One of the key themes to drop out of this year’s regional population changes was the increased influence of net internal migration movements. That’s not to say more people are moving around in absolute terms (fewer in fact, as we’ll see), it’s more a relative story as international migration has dropped back.
The numbers of internal migrants leaving the North Island for the South eased a little on last year (to 4,500, from 6,100), but this flow was still the single largest source of population growth for the South Island by far.
As the above chart shows, most of these people were destined for Canterbury. The region was easily the largest (net) recipient of people moving out of other regions. It’s something that has both driven the region’s economic outperformance as well as being a reflection of it. Otago held its position near the top coming in second, while Auckland hugged the outflow end of the spectrum for another year.
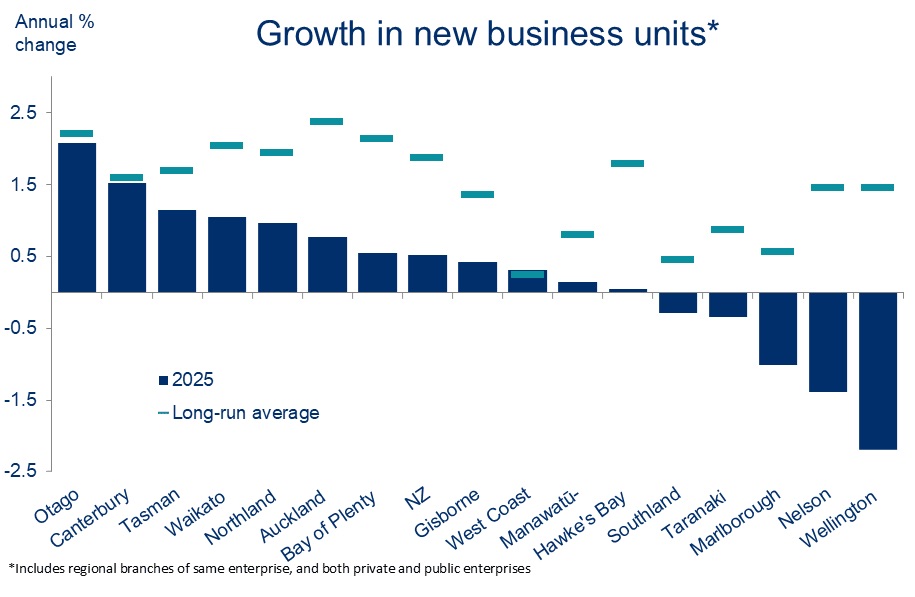
Separate business demography data, also released last week and referencing the year to February, show that these trends in internal migration line up fairly well with changes in the regional mix of business numbers.
The five strongest regions for net internal migration contributions – Canterbury, Otago, Northland, Tasman, and Waikato – exactly matched the top five for growth in new businesses in 2025. By contrast, outright declines in business numbers in Nelson/Marlborough and Wellington laid bare the difficult trading conditions in those regions.
The data don’t allow us to trace where arriving internal migrants have come from, but the anecdote would suggest a strong element of: Southland to Otago, Nelson to Tasman, and Auckland to some combination of Canterbury, Waikato, Otago and Northland.
The magnitude of internal migration flows nevertheless continued to wind down in 2025, following the peak people movements of 2020 and 2021 (chart below).
There’s obviously a bunch of reasons why people might want to up sticks. The fact fewer people are doing so may reflect the maturing of the ‘work from anywhere’ trend. But our thesis remains that convergence in regional house prices is the bigger factor.
As the below chart shows, Auckland house prices are not as expensive, relatively speaking, as they once were – dampening (but not eliminating) the incentive to shift to more affordable areas. Equally, the Waikato, Canterbury, and Otago regions are not as relatively ‘affordable’ as they once were
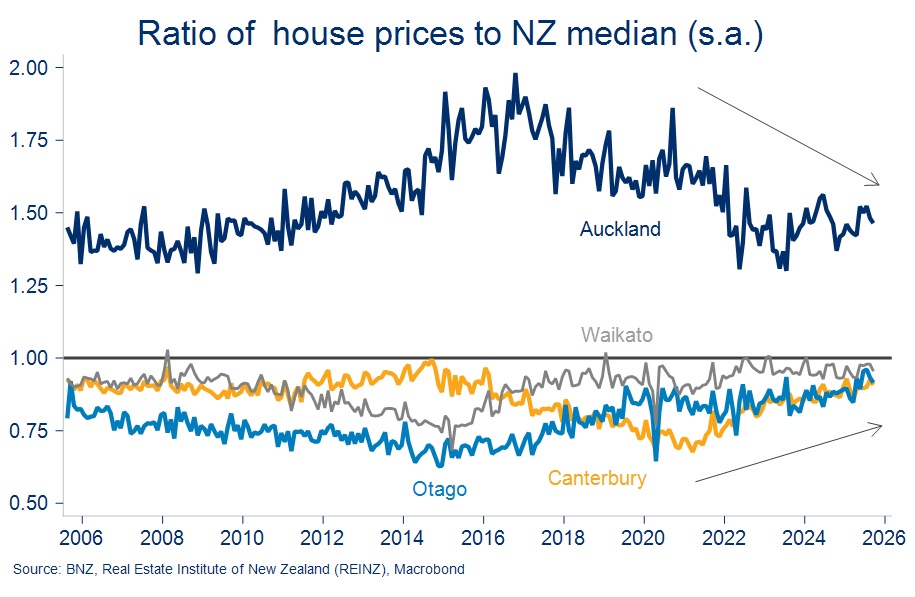
We suspect the trend is your friend here, with additional regional house price convergence likely to further slow the rates at which people are moving across regional borders.
Looking ahead
Can anything sensible be said about future population trends? Not easily. Especially given the big swing factor tends to be near-unforecastable swings in international migration.
The chart on the first page illustrates our published projections, with population growth forecast to slowly lift next year as the international migration cycle turns. Our forecasts don’t get down into the regional nitty gritty, but Stats NZ does have a crack at this every few years, and have just done so.
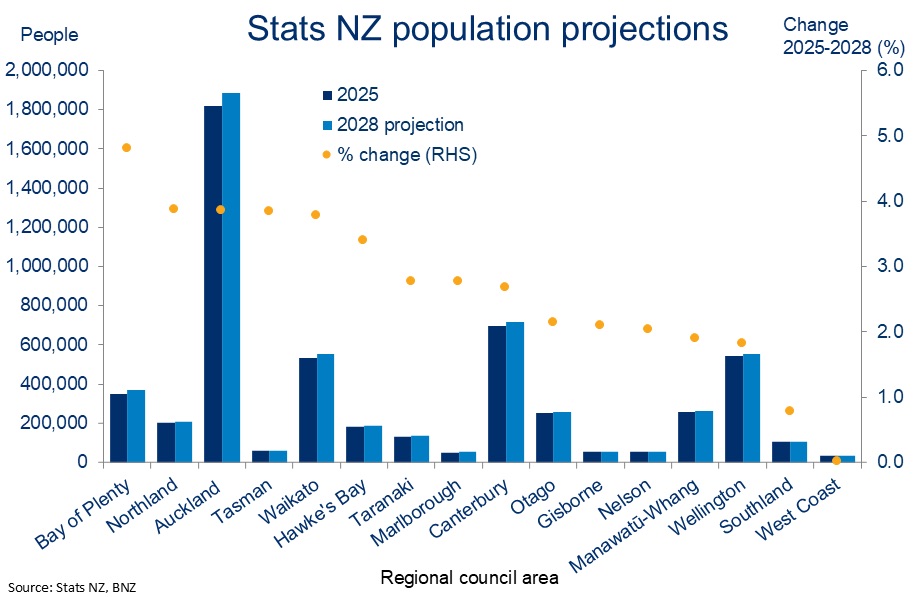
The list of health warnings associated with such estimates is understandably long. The short version is that the projections are described as “possible outcomes” and not forecasts. We’ve used the “medium” projection, with high/low also offered[2].
Caveats acknowledged, the chart shows that the Bay of Plenty, Northland, Auckland, Tasman, and Waikato regions are projected to experience the strongest population growth between now and 2028. Auckland’s size means it’s projected to account for 41% of the country’s population growth between now and then.
Notes:
[1] 2024 and 2025 estimates are also provisional.
[2] Based on different assumptions for fertility, mortality, and migration.
Home Page | Business | Previous Story | Next Story
Copyright (c) Scoop Media