 Scoop has an Ethical Paywall


Government finance statistics (general government)
Households use the lion’s share of petrol in New
Zealand – 59 percent – with the balance spread across
industries such as construction, trucking, manufacturing,
and farming, Stats NZ said today.
“A new interactive tool lets you see who supplies and who uses around 200 products that help the wheels of the economy turn, from petrol and diesel, to fertilisers/pesticides and legal services,” national accounts senior manager Gary Dunnet said.
“The tool also shows the range of connections between different parts of the economy.”
Access the tool Top suppliers and users of products.
For example, just more than half (55 percent in 2013) of petrol comes from crude oil refined in New Zealand. The balance is directly imported refined petrol. See figure 1.
Figure 1
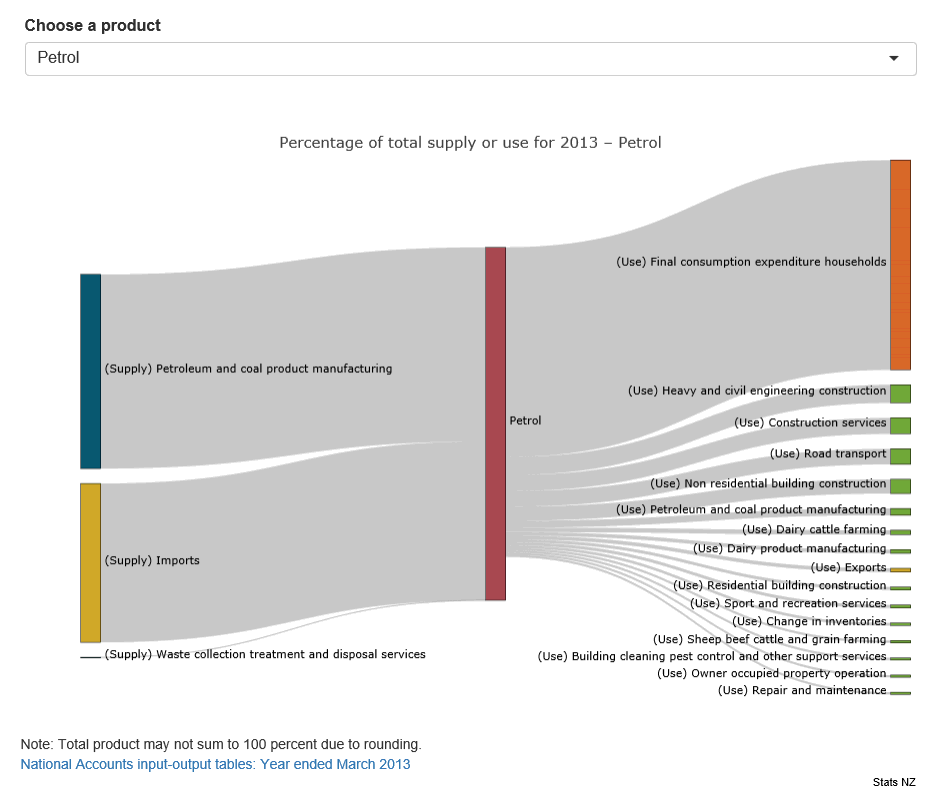
While households account for 59 percent of the final use of refined petrol, construction makes up three of the next four largest users, from civil engineering such as building roads and bridges to commercial construction (non-residential) and other building work.
Road transport is a significant business user of petrol at 4 percent. In contrast, dairy cattle farming, sheep and beef farming, and dairy product manufacturing use 1 percent of the total.
Diesel also has a wide range of consumers, although it is much more skewed towards business use, with road transport consuming the most (21 percent).
More than half of the other petroleum products are either used by the air transport industry or exported. Jet fuel is the largest contributor to this group of products, with both domestic and overseas airlines refuelling at New Zealand airports.
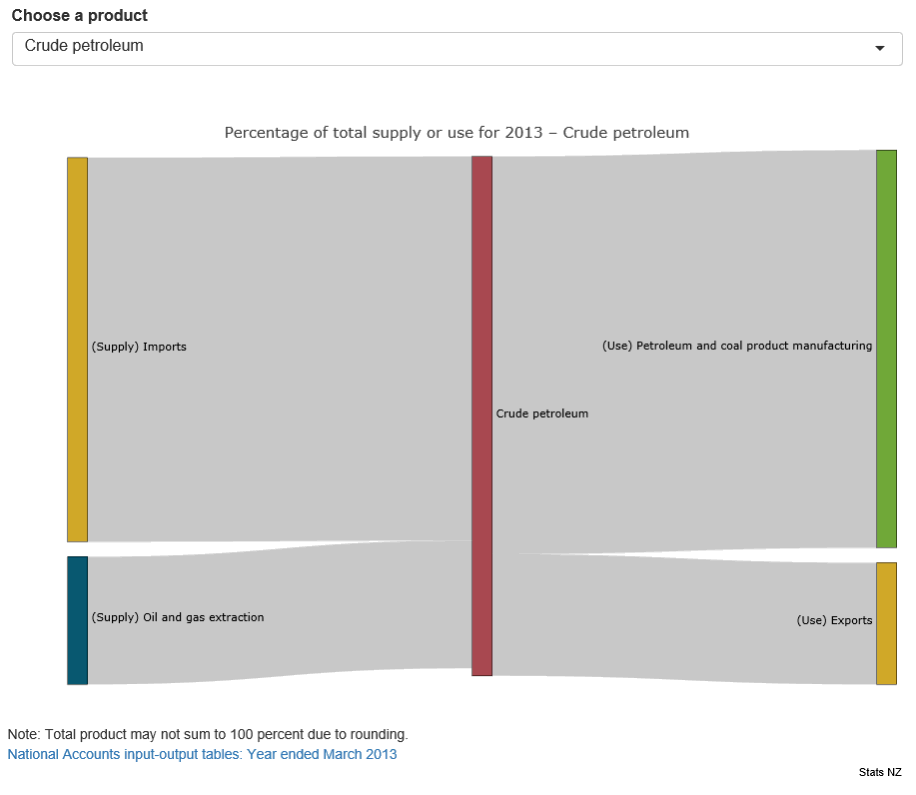
The tool also shows the flow of some products as an exchange of goods or services between only two parts of the economy, rather than across a wide range of users.
For example, the diagram for crude petroleum in figure 2 shows a close match between crude oil imports and refining or processing (industry intermediate use). This reflects purchases of raw materials by New Zealand’s petroleum and coal product manufacturing industry mainly from overseas crude oil suppliers. The remaining supply of crude oil from the New Zealand oil and gas extraction industry largely matches exports. This shows that nearly all domestic New Zealand production is destined for overseas refineries.
“In other words, much of New Zealand’s oil from Taranaki fields is sent overseas, while we import crude oil for refining,” Mr Dunnet said.
Figure 2
To see other product flows, view the tool Top suppliers and users of products.
The general pattern of product flows within
the economy tends to change slowly over time. The detailed
product breakdown used for the tool was last released in
2016 (data for the year ended March 2013). Updates are
expected every five
years.
 Spark: New Report Sets Out Outcomes-Led Approach To Lift Rural Connectivity Using The Right Mix Of Technologies
 Bill Bennett: Fixed Voice Rules Head For Deregulation
 UN Department of Global Communications: United Nations Proposes New Global Dashboard To Measure Progress Beyond GDP
 Banking Ombudsman Scheme: Fraud Check Delays Well Worth The Inconvenience, Says Banking Ombudsman
 Asia Pacific AML: NZ’s Financial Crime Gap - Beyond The 'Number 8 Wire' Mentality
 Westpac New Zealand: Kiwi Households Adapting Despite Widespread Cost Pressure Concerns, Westpac Survey Shows