 Scoop has an Ethical Paywall


Gisborne House Prices Selling For 71% Higher Than CV – Highest In NZ
The Gisborne region has seen residential properties selling on average for 71% higher than current CVs, the highest in the country, according to the latest analysis from Real Estate Institute of New Zealand (REINZ).
This is followed by Southland, where prices are around 43% higher than current CV and Hawke’s Bay and Marlborough where properties are selling for around 27% more than their current CVs.
Bindi Norwell, Chief Executive at REINZ says: “For the last 10 months in a row, since October 2019, the Gisborne region has seen purchasers pay the highest percentage over the CV for properties in the country – showing how the shortage of listings in the Gisborne region has continued to impact the East Coast.
“Whilst CVs are not what a property is ‘worth’ they are one of a range of indicators that can help understand the value of a property, and with demand for good properties exceeding supply, this is why we’re seeing such a premium being paid for properties in some parts of the country,” she continues.
“Undoubtedly, the pent-up demand after the country came out of the first lockdown has contributed to the premium people are prepared to pay for properties – particularly if they have features such as a great outdoor area, a pool, a study/office for working from home or even a large backyard,” continues Norwell.
Despite recent headlines of an uplift in sales of Auckland’s multi-million dollar mansions, particularly as Kiwis living offshore look to return home, at a regional level Auckland’s residential properties are currently selling at the closest to their CV.
“Currently, buyers are paying on average 5% over the CV in Auckland which is the most ‘affordable’ in the country – despite the fact that the current CVs are nearly three years old and were due to be updated at the end of this year,” points out Norwell.
“Interestingly, Auckland has been the region where purchasers are paying the closest to the CV for the last 11 months, and for the prior 9 months it was the only region in the country where properties were selling for below CV,” concludes Norwell.
Table 1: Sales price to valuation ratio by region by month
| Region | Jan-20 | Feb-20 | Mar-20 | Apr-20 | May-20 | Jun-20 | Jul-20 | ||||||||
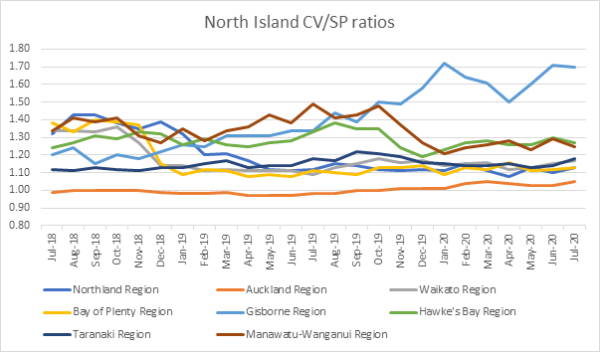
| Northland | 1.11 | 1.15 | 1.11 | 1.08 | 1.13 | 1.10 | 1.13 | ||||||||
| Auckland | 1.01 | 1.04 | 1.05 | 1.04 | 1.03 | 1.03 | 1.05 | ||||||||
| Waikato | 1.14 | 1.15 | 1.16 | 1.12 | 1.13 | 1.15 | 1.17 | ||||||||
| Bay of Plenty | 1.09 | 1.13 | 1.12 | 1.16 | 1.11 | 1.12 | 1.13 | ||||||||
| Gisborne | 1.72 | 1.64 | 1.61 | 1.50 | 1.60 | 1.71 | 1.7 | ||||||||
| Hawke's Bay | 1.23 | 1.27 | 1.28 | 1.26 | 1.26 | 1.30 | 1.27 | ||||||||
| Taranaki | 1.15 | 1.14 | 1.14 | 1.15 | 1.13 | 1.14 | 1.18 | ||||||||
| Manawatu-Wanganui | 1.21 | 1.24 | 1.26 | 1.28 | 1.23 | 1.29 | 1.25 | ||||||||
| Wellington | 1.19 | 1.18 | 1.20 | 1.17 | 1.16 | 1.17 | 1.21 | ||||||||
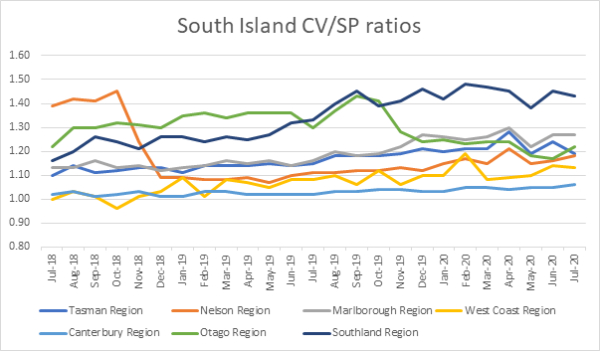
| Tasman | 1.20 | 1.21 | 1.21 | 1.28 | 1.19 | 1.24 | 1.19 | ||||||||
| Nelson | 1.15 | 1.17 | 1.15 | 1.21 | 1.15 | 1.16 | 1.18 | ||||||||
| Marlborough | 1.26 | 1.25 | 1.26 | 1.3 | 1.22 | 1.27 | 1.27 | ||||||||
| West Coast | 1.10 | 1.19 | 1.08 | 1.09 | 1.10 | 1.14 | 1.13 | ||||||||
| Canterbury | 1.03 | 1.05 | 1.05 | 1.04 | 1.05 | 1.05 | 1.06 | ||||||||
| Otago | 1.25 | 1.23 | 1.24 | 1.24 | 1.18 | 1.17 | 1.22 | ||||||||
| Southland | 1.42 | 1.48 | 1.47 | 1.45 | 1.38 | 1.45 | 1.43 |
Graph 1: North Island sales price to valuation ratio
Graph 2: South Island sales price to valuation ratio
 Bill Bennett: Fixed Voice Rules Head For Deregulation
 UN Department of Global Communications: United Nations Proposes New Global Dashboard To Measure Progress Beyond GDP
 Banking Ombudsman Scheme: Fraud Check Delays Well Worth The Inconvenience, Says Banking Ombudsman
 Asia Pacific AML: NZ’s Financial Crime Gap - Beyond The 'Number 8 Wire' Mentality
 Westpac New Zealand: Kiwi Households Adapting Despite Widespread Cost Pressure Concerns, Westpac Survey Shows
 University of Auckland: Kids’ Screen Use Linked To Long-Term Deficits In Self-Control And Attention