 Scoop has an Ethical Paywall


On-Line Maths Lesson – A Locked-Down Nightmare
Many years ago I was a recent graduate in mathematics, unsure what career to follow. My first few jobs were teaching maths to secondary school students. I soon discovered the big problem in teaching maths. Like all well-qualified maths teachers, I was good at maths – but most students were not. It was hard to cross that barrier to make maths intelligible and interesting. And the textbooks were written by writers who were good at maths, who often made things too complicated. So I tried to devise simple lessons on topics that interested students, to show them how a clear understanding of maths could improve their thinking.
One night in May 2020 – during the first great lockdown - I dreamed I was a maths teacher again. But now I was working online from home. My 24 students in 24 locations were small faces on my display screen…
-------------------------------------------------------------------------------------------------
Just a reminder about how online classes work using Locked-Up. Your microphone is muted unless I unmute it from here as administrator, so if you have a question or comment press that button and wait for me to unmute you. You can message documents and questions to me at any time, but you can’t send things to each other. And the government’s new contact tracing software will block your mobile phones too, so no chatting that way either. But don’t worry – our on-line maths class will be informative and fun!
You’ve been selected from the entire sixth form as a group of potential future leaders, who might one day be making important decisions! Immediately after maths class you’ll be working online with Ms Reddy in social studies. You will pretend to be the government of New Zealand, taking decisions about the COVID-19 pandemic. My challenge is to make sure that you understand enough about the maths to make good decisions. I’ve done some research to pull key facts together. So let’s begin!
We are facing a pandemic – a global disease. People everywhere watch with horror the “Covid Clock” at https://www.worldometers.info/coronavirus/. Most just look at headline numbers for the world as a whole plus maybe some numbers for their own country. And those headline numbers are frightening. They show big numbers and a terrifying death rate for those who catch COVID-19. But are those numbers reliable? How serious is the pandemic, and how much should we pay to fight it?
I’ll begin by revising the data I gave you yesterday. At 11 pm GMT time on Thursday, 7 May 2020, the Covid Clock showed these worldwide numbers (shares screen):
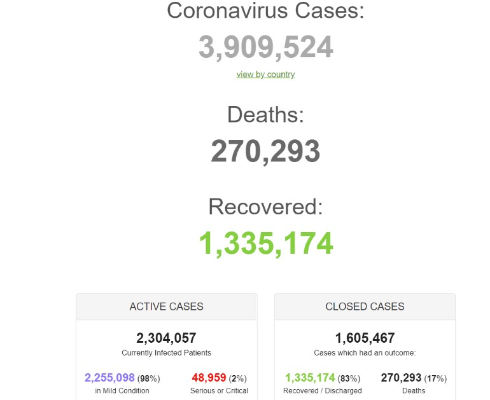
The pandemic has been raging with a widening global scope for some months now. And as you can see, the majority of the total recorded cases are still active. But the Covid Clock also tells us that only 2% of those active cases are in a serious or critical condition. The other 98% are suffering a mild health problem.
That doesn’t seem too worrying! But we know a lot of people have died already. And maybe some of the mild cases will get worse. Let’s focus on the 1.3 million closed cases and check what happened.
The Covid Clock tells us that 17% of those closed cases have died. Remember that in maths, “per cent” means per one hundred. So that’s about one in every six cases dying!
How reliable is that number? We know that only a few people have been tested, not the whole population. In fact, the Covid Clock also tells us that no large country has tested more than 4% of its population. Most have tested far fewer. Logically, that limited testing must have focused on people showing symptoms of the disease. Many other people may have become infected and recovered, without even knowing, because their case was so mild that they never went for any treatment and never got tested. And because many poorer countries simply don’t have the capacity to test and treat large numbers of people, their tested and confirmed cases must fall well below the actual closed cases in their populations. So overall, there must be many cases that haven’t been recorded on the Covid Clock. Let’s do some maths…
The calculated death rate of 17% comes from a “ratio” – one number on top, divided by another number on the bottom. The “numerator” – the maths term for the top number – is the number of deaths. Who can tell me the maths term for the bottom number– the total number of closed cases? (Presses, waits, listens)
Well, no-one got that sorry. Kelvin, thank you for suggesting “denomination” – that’s a similar sounding word about what church you go to. Maybe you heard it in Religious Studies. Don’t all laugh please!
(Turns off microphone, mutters to self: I don’t know how that boy got into this group. He belongs in the Woodwork class along with that boy Simon, or maybe in Home Economics along with Paula…)
(Turns on microphone) The actual maths term for the number on the bottom is “denominator”. Now, who can tell me how the death rate calculation would change if we counted the many cases that have not been recorded, and added that number to the denominator? (Presses, waits, listens)
That’s right, very good. The number of deaths stays the same, but the total number of cases would be bigger. So the true death rate would be lower than the Covid Clock is saying. Great! You’re learning to use maths to think critically about what you’re told.
Now here is some fresh information. Studies based on testing wider groups of people from places hit by the pandemic show us that the number of people who have been infected is much larger than the number of recorded cases. How many times larger – what we call in maths the “multiple” – will vary for a whole lot of reasons, but let’s take just three possibilities: low, medium and high. To keep the calculation simple, let’s use the multiples 5, 10 and 20. Please re-calculate the death rate in each case and send me your answer. (Waits, looks through messages)
Well done class, lots of right answers! The true death rate amongst the infected people who either died or recovered from COVID-19 is the Clock’s 17% divided by the multiple, giving these possible death rates:
- 17% divided by 20 is 0.85% – meaning fewer than one in 100 of them died. The rest recovered.
- 17% divided by 10 is 1.7% – meaning fewer than one in 50 of them died. The rest recovered.
- 17% divided by 5 is 3.4% – meaning about one in 30 of them died. The rest recovered.
Those rates are a lot different to one in six, isn’t it? But let’s use maths to dig a bit deeper. The Covid Clock suggests that all the deaths recorded there are actually caused by COVID-19. But that can’t be true. From news reports, we know that most of those dying were elderly (at least over 70, and often much older), or suffering from serious ill health conditions, or both. Some of those people might actually have died from other causes, even if they had COVID-19 when they died. How would that change the calculation and distort the figures? (Waits – listens)
Well done again class, most of you got that right. The top figure – the numerator – would be too high. And so the Covid Clock would calculate a higher death rate than the reality.
Here is more information. Medical recording procedures require doctors to list on a death certificate all the conditions that a deceased person was suffering from at the time of death. So someone with COVID-19 and other health problems might be recorded as dying from COVID-19 when they really died from another cause. How much that exaggerates the number of deaths from COVID-19 will vary according to how the doctors apply their procedures. With maths we can estimate the effect.
Italy was seriously affected in the early stages of the pandemic. A large number of deaths overwhelmed their hospital facilities. But in March the scientific adviser to Italy’s health ministry said this: “The way in which we code deaths in our country is very generous in the sense that all the people who die in hospitals with the coronavirus are deemed to be dying of the coronavirus […] On re-evaluation by the National Institute of Health, only 12 per cent of death certificates have shown a direct causality from coronavirus, while 88 per cent of patients who have died have at least one pre-morbidity – many had two or three.” A pre-morbidity is a serious health problem. So he said that only 12% – about one in eight – of those deaths were directly caused by COVID-19. The rest died with COVID-19, but maybe not from that cause. Let’s take that as an extreme case of over-recording, by 8 times, the number of deaths caused by COVID-19.
How much over-recording has happened elsewhere? It’s impossible to know. But it seems likely that all the global attention to COVID-19 has led to some over-recording. Worries about professional reputation or competition between hospitals would tend to bias doctors towards overemphasising COVID-19 as a cause of death, since the death is then more obviously "not our fault".
And instructions from health authorities could encourage over-recording. For example, the instructions issued to UK doctors about recording deaths during the emergency include a new example that refer to COVID-19. In that example, the immediate cause of death was COVID-19 leading to pneumonia. But the example also notes that person had an underlying condition of diabetes and was suffering from colon cancer. Strangely, the example also states that it was that person’s colon cancer that led to COVID-19!
(Listens) Yes good question, I know that’s not logical. But that’s the example the instructions give. I can’t understand it myself. Here’s a link to check it out. (press button)
Let’s not get bogged down in technical detail. Instead, let’s go back to maths and apply low, medium and high estimates for over-recording deaths caused by COVID-19. And let’s keep the numbers simple. We’ll take that multiple of eight from Italy as the high estimate, an over-recording multiple of two as the low estimate, and a multiple of four for a medium estimate. What happens to the three possible COVID-19 death rates that we calculated before? That will need a bit of working out, so you have 15 minutes to complete the table I’m sending you now and message me your answers. (presses button, turns off microphone, goes away for a cup of tea, comes back 10 minutes later, checks screen.)
(Mutters to self… “Oh dear. A lot of the class have switched off. Based on past form, Clarkie’s gone out to ride his mountain bike and Winston’s sneaked off for a smoke. It’s a sure thing none of them will ever reach leadership positions! …… What’s this message from Andrew?” (Reads, adjusts settings, speaks)
Hi Andrew. I’m speaking to you using Locked-Up’s privacy facility, so we don’t disturb the others. Thank you for raising your concern. But if Shane has gone off to badmouth Mr Patel at the dairy again or to give away school property to his friends, there’s not much I can do about it right now. Let’s continue our class. I promise to follow up afterwards. Thanks again. (Makes note, adjusts settings, reads messages)
Okay everyone, time’s up. I can see some of you had trouble with this calculation. I’m not surprised. Maths can be tough. To keep us moving, I’ll share my screen and show you the table of answers. (Presses button)
| Death rate after adjustment for unrecorded cases | Death rate after second adjustment for over-recording cause of death | |||
| Low (multiple 2) | Medium (multiple 4) | High (multiple 8) | ||
| Low | 0.85% | 0.425% | 0.2125% | 0.10625% |
| Medium | 1.7% | 0.85% | 0.425% | 0.2125% |
| High | 3.4% | 1.7% | 0.85% | 0.425% |
I’ve taken the adjusted death rates we had previously, and divided by the over-recording multiple that would increase the number of deaths. So what does this tell us the true death rate for COVID-19 infection might be, across the whole population?
- The highest death rate shown is now 1.7% – fewer than one person in 50 died. The rest recovered.
- The middle death rate is 0.425% – fewer than one person in 200 died. The rest recovered.
- The lowest death rate shown is 0.10625% – about one in a thousand died. The rest recovered.
But that’s for the whole population. And we know from news reports that most of the actual deaths recorded have been elderly people - at least over 70, and often much older. Or people suffering from serious ill health conditions. Or both. So the chance – what we call in maths the “probability” – that a person in good health who is not elderly will die from COVID-19 must be very low. An independent analysis of all recorded deaths over a seven-week period in UK in March and April, when the pandemic was well underway there, confirmed that. There’s a lot of detail in the tables, so I’ll just read the conclusion:
“COVID-19 does not appear to be a significant new cause of death for the vast majority of the age range of the population of England & Wales. Indeed, deaths from all other causes swamp COVID-19 death rates even amongst the very oldest males. Female COVID-19 deaths are of even less significance than for males in that over 60% of female COVID-19 deaths occur in females 80 or more years old. As such, COVID-19 death rates appear to largely replicate (indeed, reinforce) normal or ‘natural’ death patterns, i.e., the elderly males and very elderly females are the only groups significantly impacted by COVID-19. In a less hysterical world, COVID-19 wouldn’t even register as a possible/probable cause of death to any relatively heathy individual below state pension age.”
That analysis is at this link. (press button). It's an example of how advanced maths can show a real situation that is very different from the emotional perceptions people might have. Knowing reality can help you make wise decisions about what the risks really are, who is at risk and who is not, and how best to respond.
We’re not trying to come up with exact numbers here in class. We can’t. Statisticians, health authorities and governments can analyse numbers forever. There are so many potential complications! For example:
- People might die from COVID-19 in their own homes or in institutions without any test. They won’t show up as COVID-19 deaths. That would tend to understate, not overstate, death numbers!
- People might die unnecessarily from problems directly caused by emergency arrangements, because medical facilities are overloaded or treatment for their conditions has been deferred
- People might die from health conditions indirectly caused by the stress of emergency arrangements, for example through unemployment or mental ill-health
- Some countries probably lie to pretend they don’t have any cases, or not very many
- Other countries might not do their statistics properly. For example the UK Covid Clock shows the number of recovered cases as N/A – “not applicable”. Has no-one there recovered from COVID-19?
(Stops and listens) Okay class, please don’t all try to talk at once! Yes we all saw news stories that said Boris Johnson, the UK Prime Minister, had COVID-19 but is recovering. Yes, I know, he was even on TV. Sorry, but I can’t explain why the UK statistics don’t record that.
Anyway, let’s move on. I hope you can now understand why we should all think critically about what the TV news and the Covid Clock seem to be telling us, and not just react emotionally or hysterically.
Just a moment please, I have a lot of messages coming in. (Waits – listens – reads messages)
Okay, thank you. Reading your messages I see several of you are raising the same question. I think Jacinda expressed it best, like this. “I don’t like this cold and cruel discussion. Every life is priceless. And every death is a tragedy for that person. So we should spare no expense to avoid that tragedy.”
Thank you Jacinda, let’s take that idea forward into the second part of today’s lesson. How much should we spend to save a life? How much can we afford? In the real world, can we really “spare no expense”?
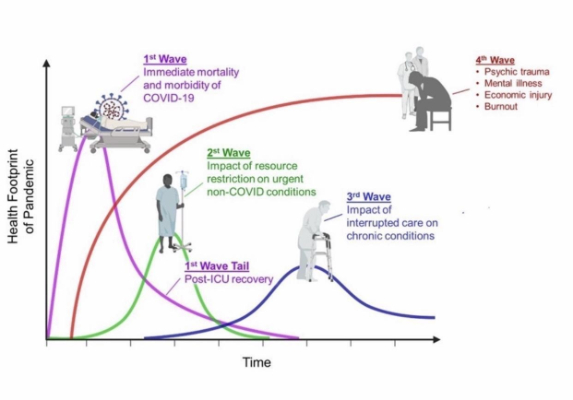
As I explained a moment ago, it’s not just about money. Saving one life may only be possible by losing another. Resources are never infinite. You can’t do everything. Sometimes indirect costs can be huge. For example, we know that closing schools has major and long-term negative consequences for society.
So decision-makers have to consider everything to decide what’s best. They have to consider not just the benefits and direct cost of any emergency actions, but also their indirect effects. In maths, we call that “optimising”. This diagram focusing mainly on individual health effects gives you the idea: (shares screen)
Let’s do some simple maths around cost.
Economic estimates of the value of one human life – how much money we should sensibly spend to save it – range between about $1m and $10m. That value can be adjusted to reflect which lives we are trying to save. However cold and cruel it might seem to you right now, as national leaders you would have to compare the value to society of an isolated and elderly person who is in institutional care and near death with the value to society of a much younger working person with a family of three children and many responsibilities. If that younger person misses important health treatment because the hospital is busy with emergency arrangements, society might end up worse off. Does anyone disagree? (Waits)
The optimising process national leaders use is called “cost-benefit analysis”. It’s hard to do, because the numbers can never be certain. And a focus on short-term effects may be quite wrong. For example, one Nobel-winning scientist concluded that the pandemic has been exaggerated. He believes that severe lockdown measures were an overreaction that will backfire on your generation “who will be left with a real mess in order to save a relatively small number of very old people”. His analysis is available at this link (press button)
Let’s try some simple maths using the top of the range of value for one human life – $10m. Imagine that you are the leaders of a nation that’s being hit by COVID-19 for the first time. You already know a bit about that disease from the experience of other countries. You can’t know exactly how many lives you can save, or the exact cost to save them, but you have estimates. The estimated maximum number of lives that can be saved by a package of extreme emergency actions is about 500. And those extreme emergency actions have been estimated to directly and indirectly cost the country about $20 billion dollars. Two questions:
- Should we take those actions, or look for a better option?
- What sort of actions would you spend money on, and roughly how much?
You have 15 minutes to message me your ideas.
(Goes off for a cup of tea, comes back, reads messages, waits)
Okay class, time’s up. Thank you, some good answers here. Most of you got the first part right. A cost of $20 billion is definitely far too much to pay to save 500 lives. We should look for a better option.
Stating what sort of actions we might take is fairly easy. Costing them can be hard though. For example, let me show you Grant’s answer. Grant has done thoughtful work to develop his spending total of just $5 billion, but there is a big flaw in his answer. Who can spot it? (shares screen, waits, reads messages)
That’s right David, as your message explains, Grant’s left a zero off on several of the key multipliers. That means he’s underestimated the cost of some actions by a factor of 10. Those pesky zeros! I’ll unmute David’s microphone and let him explain while I sign off for a few minutes.
(Turns off microphone, checks lesson plan, checks time, mutters to self: “That David is smart! Probably the only one that really belongs in this class. Of course, the others resent that, isolate him, and steal his ideas without saying so. They even make fun of his yellow shirt. Kids!” (listens, turns microphone back on)
Thanks David. So we’ve had a good example of how careful we must be when deciding to spend money – the cost – to achieve a particular benefit in saving lives. Especially when it’s public money. Any questions?
(Halts and listens) Sure Jacinda, I’ll share your question with the class. If I understand you correctly, you’re saying that it’s not reasonable to expect national leaders to understand difficult maths like that. When there is a problem, can’t they just get one of those clever people who spend their lives in universities to do the calculations and tell them what to do?
Well, yes they could. But I think that would be an irresponsible way for national leaders to behave. I would expect any national leader to work hard to fully understand the information and advice they have and make balanced decisions. And when there is a lot of difficult maths involved, I would expect the government to collect several opinions, not just hear from one academic adviser who might be biased or too theoretical. Otherwise the government might make an extreme decision or rely mainly on its emotional reactions.
What’s that Jacinda? (listens) No, I’m sorry, I have to disagree. I don’t think that’s realistic. Do you really think someone can take no interest in maths and economics, and still become a national leader just by looking cool and saying popular things? In a democracy, voting is important. Voters know they are making a serious choice. They think carefully to choose an effective national leader who has wide real-world experience, carefully develops practical policies, and can critically evaluate advice on difficult maths.
What’s that sorry Jacinda? (Listens for some time) Yes that’s true, you were elected leader of your student body without wide experience or practical policies or being good at maths. And yes I know communication is important in leadership, and you came top in Media Studies, and you won the school prize for Public Speaking. But that’s just being successful at school. I’m sure that in the real world no one would be elected a national leader just on qualifications like that! Anyway you can explore those ideas with Ms Reddy later.
Well, that’s all we have time for today. We’ll close with a heads-up about our next class. James has a great idea for that. I’ll open his microphone and let him share his screen to tell you about it. (adjusts settings)
(James speaking) Hi classmates, James here. What worries me much more than the pandemic are the negative ecological trends on our planet. We are facing serious climate change and many other problems.
And it’s not like some of my friends say, that our wasteful lifestyles here in New Zealand cause all the problems. The biggest underlying cause is that there are so many more people on the Earth, every day.
The Website that has the Covid Clock also has heaps of information about the world population. There’s even a clock for it! At precisely the same time we recorded the numbers for today’s problem – 11 PM GMT time on Thursday, 7 May 2020 – the Population Clock showed these worldwide numbers: (shares screen)
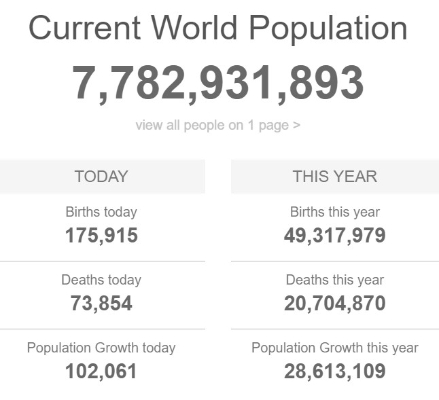
I thought it would be cool to use maths to compare those giant numbers with the much smaller numbers from the Covid Clock. And we could do other calculations too, to answer questions like these:
- How did the tsunami on Boxing Day 2004 that killed 250,000 people affect total human population?
- What will global population growth for the full year 2020 be, after adjusting for the pandemic?
- How long will it be before the world’s population reaches 10 billion?
Then we could start to work out sensible and realistic ways forward to solve the ecological problems that our generation will have to solve.
(re-adjusts settings) Thanks James! You have certainly found a maths problem worth spending time on.
Thanks everyone, see you next week. Let’s all wave to each other (all wave) and sign off (hits switch)
_______________________________________________________________________________
I woke up with a start, heart racing! I took a deep breath to calm down. It was only a nightmare…
 New Zealand College of Midwives: Celebrating Midwives Across Aotearoa This International Day Of The Midwife
 PPTA Te Wehengarua: Building The Secondary Curriculum On Broken Drafts Is A Serious Risk
 Whanganui Regional Museum: Whanganui Makers Bring Textile Traditions To Life During Symposium Weekend
 Palmerston North Hospital Foundation: Fundraising For Publicly-Owned Surgical Robot Hits $2 Million Milestone In Less Than Three Months
 Otago Shore And Land Trust: Hīkoi O Te Taoka - Larger Than Life Hoiho Statues Go To Auction For Charity
 Tertiary Education Union: Historic MECA Negotiations In Polytechnic Sector Begin