 Scoop has an Ethical Paywall


State Of Climate In 2021: Extreme Events And Major Impacts
Past 7 years set to be the warmest on record, sea level rise at new high
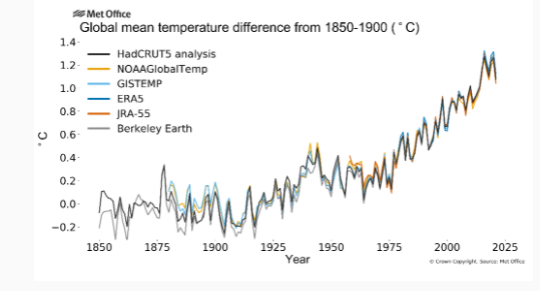
for six global temperature data sets
Geneva, 31 October 2021 (WMO) - Record atmospheric greenhouse gas concentrations and associated accumulated heat have propelled the planet into uncharted territory, with far-reaching repercussions for current and future generations, according to the World Meteorological Organization (WMO).
The past seven years are on track to be the seven warmest on record, according to the provisional WMO State of the Global Climate 2021 report, based on data for the first nine months of 2021. A temporary cooling “La Niña” event early in the year means that 2021 is expected to be “only” the fifth to seventh warmest year on record. But this does not negate or reverse the long-term trend of rising temperatures.
Global sea level rise accelerated since 2013 to a new high n 2021, with continued ocean warming and ocean acidification.
The report combines input from multiple United Nations agencies, national meteorological and hydrological services and scientific experts. It highlights impacts on food security and population displacement, harming crucial ecosystems and undermining progress towards the Sustainable Development Goals.
“The provisional WMO State of the Global Climate 2021 report draws from the latest scientific evidence to show how our planet is changing before our eyes. From the ocean depths to mountain tops, from melting glaciers to relentless extreme weather events, ecosystems and communities around the globe are being devastated. COP26 must be a turning point for people and planet," said United Nations Secretary-General António Guterres.
“Scientists are clear on the facts. Now leaders need to be just as clear in their actions. The door is open; the solutions are there. COP26 must be a turning point. We must act now – with ambition and solidarity – to safeguard our future and save humanity,” said Mr Guterres in a video statement.
“It rained – rather than snowed - for the first time on record at the peak of the Greenland ice sheet. Canadian glaciers suffered rapid melting. A heatwave in Canada and adjacent parts of the USA pushed temperatures to nearly 50°C in a village in British Columbia. Death Valley, California reached 54.4 °C during one of multiple heatwaves in the southwestern USA, whilst many parts of the Mediterranean experienced record temperatures. The exceptional heat was often accompanied by devastating fires,” said WMO Secretary-General Prof. Petteri Taalas.
“Months’ worth of rainfall fell in the space of hours in China and parts of Europe saw severe flooding, leading to dozens of casualties and billions in economic losses. A second successive year of drought in sub-tropical South America reduced the flow of mighty river basins and hit agriculture, transport and energy production,” said Prof. Taalas.
“Extreme events are the new norm,” said Prof. Taalas. “There is mounting scientific evidence that some of these bear the footprint of human-induced climate change.”
“At the current rate of increase in greenhouse gas concentrations, we will see a temperature increase by the end of this century far in excess of the Paris Agreement targets of 1.5 to 2 degrees Celsius above pre-industrial levels,” said Prof. Taalas. “COP26 is a make-or-break opportunity to put us back on track.”
The provisional State of the Climate 2021 report is released at the start of the UN Climate Change negotiations, COP26, in Glasgow. It provides a snapshot of climate indicators such as greenhouse gas concentrations, temperatures, extreme weather, sea level, ocean warming and ocean acidification, glacier retreat and ice melt, as well as socio-economic impacts.
It is one of the flagship scientific reports which will inform negotiations and which will be showcased at the Science pavilion hosted by WMO, the Intergovernmental Panel on Climate Change and the UK Met Office. During COP26, WMO will launch the Water and Climate Coalition to coordinate water and climate action, and the Systematic Observations Financing Facility to improve weather and climate observations and forecasts which are vital to climate change adaptation.
Key messages
Greenhouse Gases
In 2020, greenhouse gas concentrations reached new highs. Levels of carbon dioxide (CO2) were 413.2 parts per million (ppm), methane (CH4) at 1889 parts per billion (ppb)) and nitrous oxide (N2O) at 333.2 ppb, respectively, 149%, 262% and 123% of pre-industrial (1750) levels. The increase has continued in 2021.
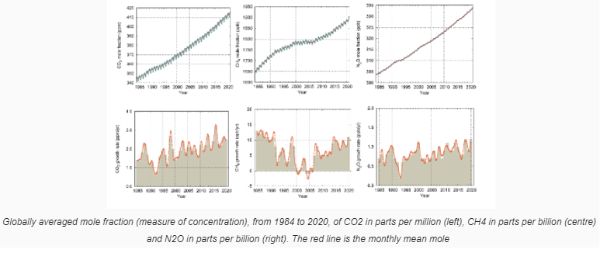
Globally averaged mole fraction (measure of concentration), from 1984 to 2020, of CO2 in parts per million (left), CH4 in parts per billion (centre) and N2O in parts per billion (right). The red line is the monthly mean mole
Temperatures
The global mean temperature for 2021 (based on data from January to September) was about 1.09°C above the 1850-1900 average. Currently, the six datasets used by WMO in the analysis place 2021 as the sixth or seventh warmest year on record globally. But the ranking may change at the end of the year.
It is nevertheless likely that 2021 will be between the 5th and 7th warmest year on record and that 2015 to 2021 will be the seven warmest years on record.
2021 is less warm than recent years due to the influence of a moderate La Niña at the start of the year. La Niña has a temporary cooling effect on the global mean temperature and influences regional weather and climate. The imprint of La Niña was clearly seen in the tropical Pacific in 2021.
The last significant La Niña event was in 2011. 2021 is around 0.18°C to 0.26 °C warmer than 2011.
As the 2020-21 La Niña has waned,
monthly global temperatures have increased. The year 2016,
which started during a strong El Niño, remains the warmest
year on record in most of the data sets
surveyed.
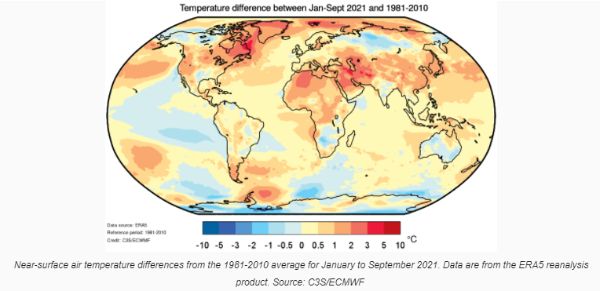
Near-surface air temperature differences from the 1981-2010 average for January to September 2021. Data are from the ERA5 reanalysis product. Source: C3S/ECMWF
Ocean
Around 90% of the accumulated heat in the Earth system is stored in the ocean, which is measured through Ocean Heat Content.
The upper 2000m depth of the ocean continued to warm in 2019 reaching a new record high. A preliminary analysis based on seven global data sets suggests that 2020 exceeded that record. All data sets agree that ocean warming rates show a particularly strong increase in the past two decades and it is expected that the ocean will continue to warm in the future.
Much of the ocean experienced at least one ‘strong’ Marine Heatwave at some point in 2021 – with the exception of the eastern equatorial Pacific Ocean (due to La Niña) and much of the Southern Ocean. The Laptev and Beaufort Sea in the Arctic experienced “severe” and “extreme” marine heatwaves from January to April 2021.
The ocean absorbs around 23% of the annual emissions of anthropogenic CO2 to the atmosphere and so is becoming more acidic. Open ocean surface pH has declined globally over the last 40 years and is now the lowest it has been for at least 26,000 years. Current rates of pH change are unprecedented since at least that time. As the pH of the ocean decreases, its capacity to absorb CO2 from the atmosphere also declines.
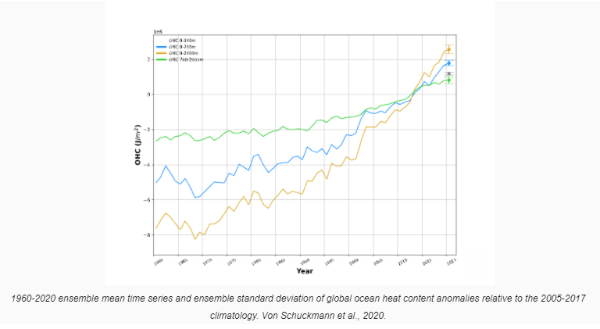
1960-2020 ensemble mean time series and ensemble standard deviation of global ocean heat content anomalies relative to the 2005-2017 climatology. Von Schuckmann et al., 2020.
Sea level
Global mean sea level changes primarily result from ocean warming via thermal expansion of sea water and land ice melt.
Measured since the early 1990s by high precision altimeter satellites, the mean global mean sea level rise was 2.1 mm per year between 1993 and 2002 and 4.4 mm per year between 2013 and 2021, an increase by a factor of 2 between the periods. This was mostly due to the accelerated loss of ice mass from glaciers and ice sheets.
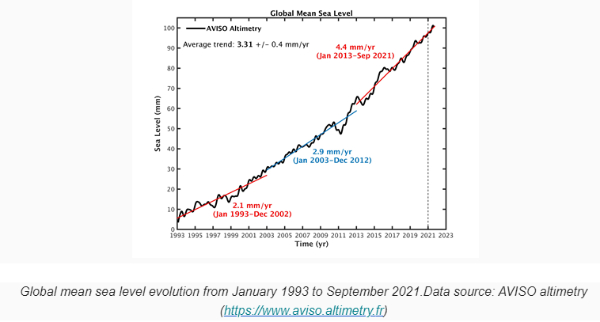
Global mean sea level evolution from January 1993 to September 2021.Data source: AVISO altimetry (https://www.aviso.altimetry.fr)
Sea
Ice
Arctic sea ice was below the 1981-2010 average at its maximum in March. Sea-ice extent then decreased rapidly in June and early July in the Laptev Sea and East Greenland Sea regions. As a result, the Arctic-wide sea-ice extent was record low in the first half of July.
There was then a slowdown in melt in August, and the minimum September extent (after the summer season) was greater than in recent years at 4.72 million km2. It was the 12th lowest minimum ice extent in the 43-year satellite record, well below the 1981-2010 average. Sea-ice extent in the East Greenland Sea was a record low by a large margin.
Antarctic sea ice extent was generally close to the 1981–2010 average, with an early maximum extent reached in late August.
Glaciers and ice sheets
Mass loss from North American glaciers accelerated over the last two decades, nearly doubling for the period 2015-2019 compared to 2000-2004. An exceptionally warm, dry summer in 2021 in western North America took a brutal toll on the region's mountain glaciers.
The Greenland Ice Sheet melt extent was close to the long-term average through the early summer. But temperatures and meltwater runoff were well above normal in August 2021 as a result of a major incursion of warm, humid air in mid-August.
On August 14, rain was observed for several hours at Summit Station, the highest point on the Greenland Ice Sheet (3 216 m), and air temperatures remained above freezing for about nine hours. There is no previous report of rainfall at Summit. It marks the third time in the last nine years that the Summit has experienced melting conditions. Ice core records indicate that only one such melt event occurred in the 20th century.
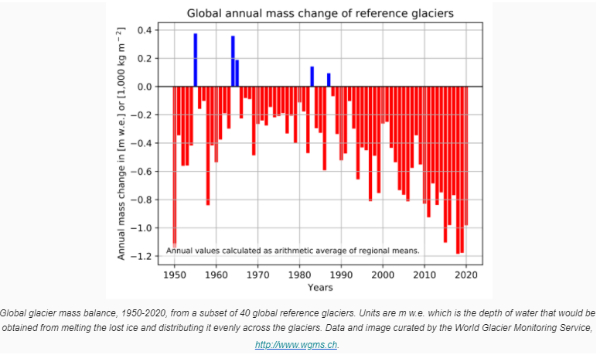
Global glacier mass balance, 1950-2020, from a subset of 40 global reference glaciers. Units are m w.e. which is the depth of water that would be obtained from melting the lost ice and distributing it evenly across the glaciers. Data and image curated by the World Glacier Monitoring Service, http://www.wgms.ch.
Extreme
weather
Exceptional heatwaves affected western North America during June and July, with many places breaking station records by 4°C to 6°C and causing hundreds of heat-related deaths. Lytton, in south-central British Columbia, reached 49.6 °C on 29 June, breaking the previous Canadian national record by 4.6 °C and was devastated by fire the next day.
There were also multiple heatwaves in the southwestern United States. Death Valley, California reached 54.4 °C on 9 July, equalling a similar 2020 value as the highest recorded in the world since at least the 1930s. It was the hottest summer on record averaged over the continental United States.
There were numerous major wildfires. The Dixie fire in northern California, which started on 13 July, had burned about 390,000 hectares by 7 October, the largest single fire on record in California.
Extreme heat affected the broader Mediterranean region. On 11 August, an agrometeorological station in Sicily reached 48.8 °C, a provisional European record, while Kairouan (Tunisia) reached a record 50.3 °C. Montoro (47.4 °C) set a national record for Spain on 14 August, while on the same day Madrid had its hottest day on record with 42.7 °C.
On 20 July, Cizre (49.1 °C) set a Turkish national record and Tbilisi (Georgia) had its hottest day on record (40.6 °C). Major wildfires occurred across many parts of the region with Algeria, southern Turkey and Greece especially badly affected.
Abnormally cold conditions affected many parts of the central United States and northern Mexico in mid-February. The most severe impacts were in Texas, which generally experienced its lowest temperatures since at least 1989. An abnormal spring cold outbreak affected many parts of Europe in early April.
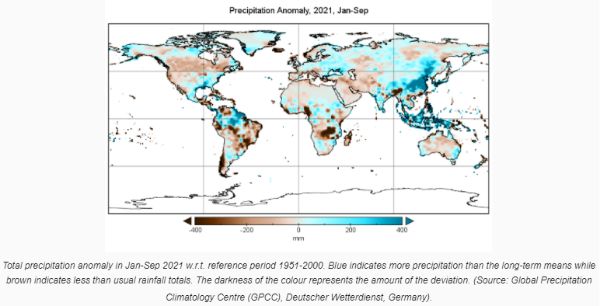
Precipitation
Extreme rainfall hit Henan Province of China from 17 to 21 July. The city of Zhengzhou on 20 July received 201.9 mm of rainfall in one hour (a Chinese national record), 382 mm in 6 hours, and 720 mm for the event as a whole, more than its annual average. Flash floods were linked to more than 302 deaths, with reported economic losses of US$17.7 billion.
Western Europe experienced some of its most severe flooding on record in mid-July.
Western Germany and eastern Belgium received 100 to 150 mm over a wide area on 14-15 July over already saturated ground, causing flooding and landslides and more than 200 deaths. The highest daily rainfall was 162.4 mm at Wipperfürth-Gardenau (Germany).
Persistent above-average rainfall in the first half of the year in parts of northern South America, particularly the northern Amazon basin, led to significant and long-lived flooding in the region. The Rio Negro at Manaus (Brazil) reached its highest level on record. Floods also hit parts of East Africa, with South Sudan being particularly badly affected.
Significant drought affected much of subtropical South America for the second successive year. Rainfall was well below average over much of southern Brazil, Paraguay, Uruguay and northern Argentina. The drought led to significant agricultural losses, exacerbated by a cold outbreak at the end of July, damaging many of Brazil’s coffee-growing regions. Low river levels also reduced hydroelectricity production and disrupted river transport.
The 20 months from January 2020 to August 2021 was the driest on record for the southwestern United States, more than 10% below the previous record. Forecast wheat and canola crop production for Canada in 2021 is 30 to 40% below 2020 levels. A malnutrition crisis associated with drought gripped parts of the Indian ocean island of Madagascar.
Total precipitation anomaly in Jan-Sep 2021 w.r.t. reference period 1951-2000. Blue indicates more precipitation than the long-term means while brown indicates less than usual rainfall totals. The darkness of the colour represents the amount of the deviation. (Source: Global Precipitation Climatology Centre (GPCC), Deutscher Wetterdienst, Germany).
Attribution
Preliminary “rapid attribution” studies have been carried out for the heatwave in northwest America in June and July and of floods in western Europe in July. The study of the heatwave in the Pacific Northwest found that the heatwave is “still rare or very rare in today’s climate, but would have been virtually impossible without climate change.”
For the western Europe flooding, it was found that the heavy rainfall “had been made more likely by climate change.”
More generally, events such as these fit into a broader pattern of change. The IPCC Sixth Assessment Report (AR6) concluded that the frequency of heatwaves in North America and the Mediterranean has increased. A human contribution to these increases was found with medium confidence in North America and high confidence in the Mediterranean region.
The IPCC reported that heavy precipitation has increased in east Asia, but there is low confidence of human influence. There was high confidence of a human influence on heavy precipitation in northern Europe, but low confidence in west and central Europe.
Socio-economic and environmental impacts
In the last ten years, conflict, extreme weather events and economic shocks have increased in frequency and intensity. The compounded effects of these perils, further exacerbated by the COVID-19 pandemic, have led to a rise in hunger and, consequently, undermined decades of progress towards improving food security
Following a peak in undernourishment in 2020 (768 million people), projections indicated a decline in global hunger to around 710 million in 2021 (9%). However, as of October 2021, the numbers in many countries were already higher than in 2020
This striking increase (19%) was mostly felt among groups already suffering from food crises or worse (IPC/CH Phase 3 or above), rising from 135 million people in 2020 to 161 million by September 2021
Another dire consequence of these shocks was the growing number of people facing starvation and a total collapse of livelihoods (IPC/CH Phase 5), mostly in Ethiopia, South Sudan, Yemen, and Madagascar (584 000 people).
Extreme weather during the 2020/2021 La Niña altered rainfall seasons contributing to disruptions to livelihoods and agricultural campaigns across the world. Extreme weather events during the 2021 rainfall season have compounded existing shocks.
Consecutive droughts across large parts of Africa, Asia, and Latin America have coincided with severe storms, cyclones and hurricanes, significantly affecting livelihoods and the ability to recover from recurrent weather shocks.
Extreme weather events and conditions, often exacerbated by climate change, have had major and diverse impacts on population displacement and on the vulnerability of people already displaced throughout the year. From Afghanistan to Central America, droughts, flooding and other extreme weather events are hitting those least equipped to recover and adapt
Ecosystems – including terrestrial, freshwater, coastal and marine ecosystems – and the services they provide, are affected by the changing climate. In addition, ecosystems are degrading at an unprecedented rate, which is anticipated to accelerate in the coming decades. The degradation of ecosystems is limiting their ability to support human well-being and harming their adaptive capacity to build resilience.
..................................................................................................................................
Information used in this report is sourced from a large number of National Meteorological and Hydrological Services (NMHSs) and associated institutions, as well as Regional Climate Centres, the World Climate Research Programme (WCRP), the Global Atmosphere Watch (GAW), the Global Cryosphere Watch and the EU’s Copernicus Climate Change services. United Nations partners include the Food and Agriculture Organization of the United Nations (FAO), Intergovernmental Oceanographic Commission of UNESCO (UNESCO-IOC), International Organization for Migration (IOM), the United Nations Environment Programme (UNEP), UN High Commissioner for Refugees (UNHCR), the UN Office for Disaster Risk Reduction (UNDRR and the World Food Programme (WFP).
WMO extends its gratitude for all the dedicated hard work from WMO’s network of experts which makes this report an authoritative source of information on the state of the climate and on climate impacts. We are especially grateful to the UK Met Office, which acted as lead author of this report.
Where possible the WMO climatological standard normal, 1981-2010, is used as a base period for consistent reporting. For some indicators however, it is not possible to use this baseline due to a lack of measurement during the whole period or because a longer period is needed to calculate representative statistics.
For global mean temperature, a baseline of 1850-1900 is used. This is the baseline used in recent IPCC reports as a stand in for pre-industrial temperatures and is relevant for understanding progress relative to the aims of the Paris Agreement.
WMO uses six international datasets for temperatures HadCRUT.5.0.1.0 (UK Met Office), NOAAGlobalTemp v5 (USA), NASA GISTEMP v4 (USA), Berkeley Earth (USA), ERA5 (ECMWF), JRA-55 (Japan).
 UN News: Uncertainty Continues Over Safety In The Strait Of Hormuz
 Australian Museum: Celebrate Sir David Attenborough's 100th Birthday With The Australian Museum
 Clean Shipping Coalition: Shipping - IMO’s Net Zero Framework Progresses But ENGOs Slam Unnecessary Delay
 Gena Wolfrath, IMI: Understanding News Fatigue—and How To Stay Informed Without Overload
 Access Now: A Statement To Our Community About Why RightsCon 2026 Will Not Take Place In Zambia
 Climate Action Network: Santa Marta Plants The Seeds Of A Fossil-Free Future - Civil Society Will Hold Governments To Account