 Scoop has an Ethical Paywall


Keith Rankin: Good Timing

Good Timing
Keith Rankin, 18 July 2002
The economy doesn't rate as much of an issue this election. OK, there are the usual concerns about health and education spending. But there is no sense of economic crisis, and no great willingness to engage in a philosophical debate about matters of political economy.
That is partly because economies - national and international - have their own cyclical rhythms. When the economy is going through a favourable phase of the cycle, the sun is shining, and the leak in the roof can be safely ignored. Further, a favourable phase of the economic cycle is always good news to a government facing an election.
I have traced New Zealand's economic cycles back into the 19th century. The present cyclical pattern seems to go back, with quite a bit of precision, to the 1960s (and, with less precision, to the 1940s). This knowledge can help me to make economic forecasts, political predictions, and can be used to evaluate the performance of past governments with respect to their management of the national economy.
The study of economic cycles became very popular in the 1920s and 1930s. Two of the most important names are those of Nikolai Kondratieff and Joseph Schumpeter.
Kondratieff, in Russia, predicted the Great Depression of the 1930s in the 1920s. He eventually lost his life in Stalin's purges. His crime? He predicted that the western capitalist countries would recover from the Great Depression.
Schumpeter's analysis of the Great Depression, Business Cycles, was published in 1939. Using the work of Kondratieff and others, Schumpeter explained the Great Depression as a conjuncture of three economic cycles. In the early 1930s, the three cycles downwardly reinforced each other.
The management of "the business cycle" remain the central task of macroeconomic policy. But in the hands of J.M. Keynes, who published his general theory in 1936, business cycles ceased to be regarded as regular "endogenous" phenomena. Instead they became mere upturns, downturns and recessions that could be short- or long-lived. Works like that of Schumpeter became unfashionable until the 1990s, and even then it was some other works of Schumpeter that grabbed the attention of young heterodox economists.
My investigations in the 1990s suggested that there are regular cycles at work in New Zealand. On 31 December 1998, I published an article on the web called "Cycles of Growth" (http://pl.net/~keithr/ rf98_GrowthCycles.html).
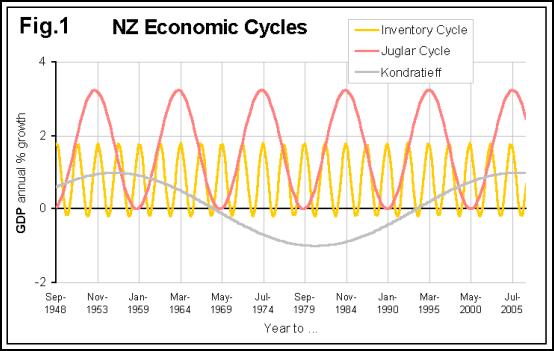
The short-period business cycle lasts for 31 months. It appears to be a uniquely New Zealand cycle, although similar cycles almost certainly exist in all other capitalist countries. I understand it as an inventory or 'trade' cycle. I have timed each medium-period cycle at just over 10 years. This "Juglar" cycle is more synchronised with those of other countries and appears to be linked to waves of what economists call "fixed capital formation", with say factories, railways, motorways or fibre-optic cable as possible leading sectors. The longer cycle, the Kondratieff cycle, is the most contentious, and is fully international. It is usually presented as being a 50-year cycle, with troughs in the thirties' and eighties' decades. Historically, inflation and deflation have been important indicators of the phases of this cycle.
The first graph in my 1998 article, shown below, shows sine waves depicting the three cycles. The size and timing of the two shorter cycles were calculated from two decades of New Zealand data (1978-98), and extended to cover nearly six decades from 1948 to 2005.
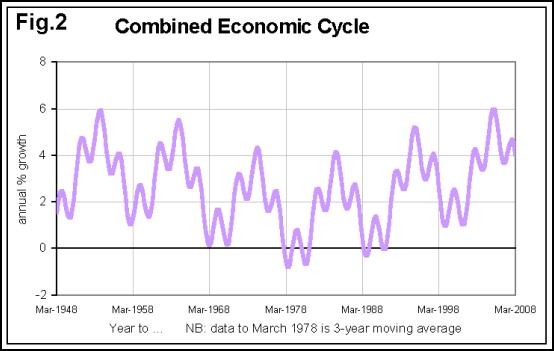
The second graph, below, shows the three cycles superimposed. This gives a kind of economic template or "counterfactual" of the New Zealand economy for the post World War 2 period. Graph 2 shows what annual growth rates of New Zealand's gross domestic product (GDP) would probably have been in the absence of external economic shocks, significant policy interventions, and other random variations.
Graphs 3 and 4 below compare my template with what actually did happen. Graph 3 suggests some interesting stories in our past, such as what was going on in the early and late 1950s. But that's another story. It's graph 4 that we need to focus on here.

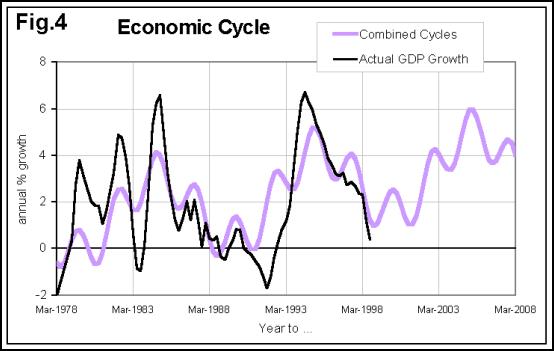
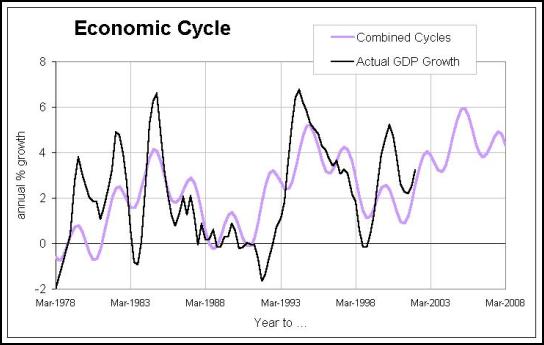
Graph 4 predicts a downturn in 1998 and another in 2000. Did they happen? Yes they did. I can now add an update of graph 4, using the very latest GDP statistics. We'll call this graph 5.
Before going on, we should note that the growth rates given, which are plotted every three months, represent the entire last 12 months compared to the previous whole 12 months. This is a very conservative way of plotting growth, favoured more by economic historians than by forecasters. This means that at the times of the high points shown, the next downturn has already begun. Thus the most favoured parts of the cycles - especially the short cycles - are the rising phases rather than the peaks.
In July 2002, we are at the most favourable phase in the short cycle, we are in full recovery from a trough in the middle cycle, and we are well into a Kondratieff upswing. Economically speaking, these are benign times. By November, the downswing on the short cycle - driven down by rising interest and exchange rates - will be more apparent. This month was a good month for Labour to call the election. (This knowledge must be tempered by the observation that November 1999 was economically favourable to the Shipley government.)
What of the next election? First, I would not be surprised if we move into a pattern of having elections in late June rather than in October or November. (Seasonal employment tends to peak from March to June.) So I am predicting that the next election will be on 25 June 2005.
In June 2005, we find all three cycles peaking. (Go back to Graph 1.) So, unless the next government really makes a botch of its economic policies, whoever wins this election (almost certainly Labour) will also win the next one (much as National won in 1963). 2008 may be tough though.
So I'm predicting a favourable economy over the next five years, and an easy ride for whoever becomes the government in August. But we may underperform, relative to the template that I'm basing my predictions on.
The upswing of the Kondratieff cycle is usually a harbinger of inflation; 1910s and 1960s style inflation. I suggest that we are moving into times when inflation rates will average around 5% in developed capitalist economies. If we try to suppress that inflation, our economy will fall further behind countries like Australia by the latter part of this decade. Hence the debate that Finance Minister Michael Cullen has been trying to start is a very important one, and not simply a personal scrap with former Reserve Bank governor Don Brash. (The good news over the next 6 years, I am predicting, is that Don Brash will not become Minister of Finance. Rather he will serve for 6 years as Dr Cullen's pin cushion.)
My interpretation of our growth cycles also tells me that the low inflation of the 1990s happened despite rather than because of the 1989 Reserve Bank Act and Dr Brash's generally tight monetary policies. In the 1890s prices fell markedly. Further, were it not for the high costs imposed on the global capitalist economy by policy-induced high interest rates, especially from 1974 to 1984, we would have had two to three decades of deflation, much as happened in the nineteenth century.
Mind you, that deflation caused a whole lot of problems in the 19th century that we avoided. The irony is that a monetary policy that was meant to stabilise by placing downward pressure on prices may have actually stabilised by placing upward pressure on prices.
We can only evaluate the effects of our macroeconomic policies by comparing what did happen with what would have happened in the absence of those policies. Economic historians call the "what would otherwise have happened" template a "counterfactual" scenario. Of course, there can be as many counterfactuals as there are economic historians. The important thing is that you have to present an argument as to what otherwise would have happened before you can make judgements about what did happen.
In the meantime, I'm happy to bask in the satisfaction of having correctly predicted New Zealand's cyclical turning points since 1998.
Keith Rankin
Political Economist, Scoop Columnist
Keith Rankin taught economics at Unitec in Mt Albert since 1999. An economic historian by training, his research has included an analysis of labour supply in the Great Depression of the 1930s, and has included estimates of New Zealand's GNP going back to the 1850s.
Keith believes that many of the economic issues that beguile us cannot be understood by relying on the orthodox interpretations of our social science disciplines. Keith favours a critical approach that emphasises new perspectives rather than simply opposing those practices and policies that we don't like.
Keith retired in 2020 and lives with his family in Glen Eden, Auckland.
 Ramzy Baroud: The Assault On A French Nun And The Forgotten Story Of Palestinian Christians
 Frances Palmer: Defending Values In A Volatile World
 Peter Dunne: Dunne's Weekly - Waititi Correct, But Unlikely To Get His Wish
 Keith Rankin: Does The United States Have A Debt Problem That Needs Fixing?
 Bruce Mahalski: Change In The Weather #195
 Keith Rankin: Haemorrhagic Plague?