 Scoop has an Ethical Paywall


Dr. Abbas Bakhtiar: Who Will Pay the US Debt
Who Will Pay the US Debt
By Dr. Abbas Bakhtiar
“The poverty of our century is unlike that of any other. It is not, as poverty was before, the result of natural scarcity, but of a set of priorities imposed upon the rest of the world by the rich. Consequently, the modern poor are not pitied...but written off as trash. The twentieth-century consumer economy has produced the first culture for which a beggar is a reminder of nothing."
(John Berger)
Some months back, I wrote an article “the Coming Financial Crises” as a warning to the American people about the US debt, budget and trade deficit. Since then the situation has continued to worsen and no-one it seems is willing to address this important issue.
When George W. Bush became president in 2001, the United States’ public debt was 5.8 trillion dollars. Today the public debt stands at 8.3 trillion dollars [1 ]. Of this over amount, $2.2 trillion dollars is held by foreigners [2 ]. United States has a GDP of 12.4 trillion dollars. This gives U.S. a Debt/GDP ratio of 66%, placing it in 35th place (out of 113) on the ranking of the Debtor Nations [3 ]. The current account deficit of over 7 per cent has long passed its danger levels of 4-5 per cent. In 2005 the U.S. government paid $325 billion dollars in interest payments.
Added to this are the future obligations such as Medicare $30 Trillion dollars, Social Security: $12.7 Trillion dollars, Federal debt: +$4.3 trillion dollars, Federal and Military pensions $3.9 trillion dollars and other debts of $2.2 trillion dollars. These obligations amount to $53 trillion dollars will become due in 2008 when over 78 million baby boomers begin to retire. [4 ]
It seems that these astronomical sums worry only a few in the academia for the politicians, the Wall Street experts and the media constantly talk about the continuing good times and/or a controlled cooling down of the economy. This simply doesn’t add-up. Who are they fooling and why?
The fact is that those in power do not want to be blamed for this mess. Bush can not in all honesty justify his huge tax-cut to the rich in the face of these economic imbalances, nor can he explain the necessity of spending so much on such things as his elective War in Iraq. The long-term cost of the Iraq war is estimated to be between $1 to $2 trillion dollars [5 ]. He is also thinking about starting another war with Iran that will be even more costly than the Iraq and Afghanistan wars. How is he going to justify his fiscal irresponsibility if it came out that there was no money for pensioners or social security?
A pertinent question to ask would be why the opposition party is not informing the public about the economic crisis facing the US. The simple answer is that the opposition does not want to ruin it’s chances of being elected. It is unlikely that voters would cast their ballot in favour of a candidate/party who is going to increase taxes and cut social spending. Also the current political system is such that anyone that goes against the rich and the special interest groups will not receive the necessary funds for his/her election campaign.
If we look at the election results we see that money plays a central and important role in determining the outcome; in other words, money talks.
Money talked with a roaring voice in the 2002 midterm elections, according to a post-election analysis by the non-partisan Center for Responsive Politics. Just under 95 percent of U.S. House races and 76 percent of Senate races were won by the candidate who spent the most money, the Center found. That translates into 413 of 435 House races and 26 of 34 Senate races. The findings are based on candidates' final reports for the 2002 election cycle filed with the Federal Election Commission. [6 ]
Running for a seat in the Senate or the congress is prohibitively expensive. Running for president is even more expensive than the senate or the congress. The actual costs are immense. For example in 1992, the two political parties spent $220 million dollars on behalf of their presidential candidates. The total cost with government’s contributions etc, was $550 million dollars.
“The costs of electing a president -- some $550 million -- represent about one-sixth of the nation's $3.2 billion ($3.200 million) political campaign bill in 1992. The remaining funds were spent to nominate and elect candidates for Congress ($678 million), to nominate and elect hundreds of thousands of state and local officials ($865 million), and to pay the costs of state and local ballot issue campaigns and administrative, fund-raising and other expenses of party and non-party political committees.”[7 ]
But where did all this money come from and why? Some money was provided by people like you and me with donations of maximum of $1000. But just to cover the presidential election we would need 200000 people each sending in $1000 to the party headquarters. We know of course that this wasn’t the case. It was the special interest groups and the lobbyists that provided a substantial contribution to each candidate’s campaign costs. Of course the rich (owners of corporations etc) can not contribute directly, so they contribute to Political Actions Committees (PACs) which in turn make donations directly to candidates.
As can be seen this system is skewed in favour of the candidates with money. Those candidates are in turn beholden to their party and PACs, making them dependent on the rich and powerful for finances. In the end, the candidate has to consider the interest of these powerful groups before making any decision. That is why sometimes one sees different administrations adapting policies that are against the long-term interest of the nation without any meaningful protest by the people’s representatives in the congress or the Senate.
The current economic crisis was not created by this administration alone (although they contributed greatly to it) and can not be solved by the next president either. It will require a long and painful change in the spending habits of the people, a marked reduction in their economic expectations, and a better and more equitable distribution of wealth and income. But most importantly, it requires a restructuring of the current election system and it’s financing. But until then (if that day ever comes), the government has to somehow pay the debt, reduce its expenditure and substantially increase taxes. No matter how one looks at it, the majority of the people will feel the coming financial hardship.
The Economic Situation of the Americans
For the country the solution is simple enough (on paper): reduce expenditure and increase income. This is usually done by cutting some of social services and benefits on the expense side and increase the income by increasing the taxes. Of course this doesn’t have to be simultaneous. But considering the size of the budget deficit, trade deficit and the coming obligations, a combination of both will be necessary.
But we know that any reduction in services will impact the living standard of those relying on those services. A reduction in welfare support will affect not only the recipients but also their dependants. A reduction in healthcare services will affect a large number of people and again their dependants. Of course any reduction in social spending by the governments will have a minimum impact on the wealthy. They seldom use government services such as healthcare or subsidies. Yes they use the courts and roads and the police, etc, but all-in-all the effect of social expenditure cuts on their lives will be minimal.
Furthermore, an increase in taxes will impact various groups differently. For example, any increase in taxes will either not affect or minimally concern those 23 million households that earn close to $15000 dollars per year or less. However the working poor and especially the debt laden middle classes will be hard pressed to cope.
To get a proper understanding of the people’s economy and their ability to cope with any reduction in services or a substantial increase in taxes, we shall look at the population as presented by congressional budget office. Please note that the poverty threshold for 2004 was set at $19,307 dollars for a family of 4.
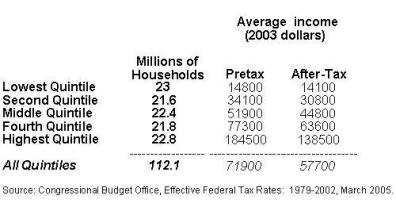
The table above reports values both for the entire population and for quintiles (quintile = 20%) of the income distribution. The Quintiles are supposed to contain equal numbers of people, but because households vary in size, the quintiles provided by the Congressional Budget Office generally contain unequal numbers of households.
According to this table, in 2003, the bottom quintile or 23 million households earned $14800 per year while the top quintile or 22.8 million household had an income of $184500.
a. The Lowest Quintile
According to the US Census Bureau, from 2000 to 2004 the number of people living in poverty in United States increased by 5.4 million people, going from 31,6 million to 37.0 million [8 ]; of which 36% or over 13 million were children [9 ].According to Martha Burt, principal research associate in the Urban Institute's Center on Labor, Human Services and Population, during a year about 10% of these people or close to 3.7 million people will experience homelessness.
These 37 million people are at the bottom of the society and to a large extent ignored by others, even the government. The government has tried to reduce it’s expenditure by restricting access to social benefits and in some cases, by requiring the poor to work.
For example, the new law passed in 2006 requires that welfare recipients work for at least 30 hours per week, 20 hours of which must be in approved activities such as public or private jobs, training related to a job, vocational training, job search, community service, or providing day care for persons performing community service.
This rule and others like it are created to reduce the budget deficit rather than helping the poor. For example this rule was included in a $39 billion budget-cutting bill that Bush signed in February 2006. What Bush and others seem to have forgotten is that if a single parent is forced to go to work, who is going to look after the children. According to the U.S. Census Bureau, in 2005, there were close to 4 million poor Female householders with no husbands present. If these mothers were to go to work, who is going to look after the children? Naturally if the law requires that a welfare recipient should work, the burden of enforcing the rule is put on the state authorities. They are the ones that have to pay for the child care services.
According to Arizona Republic, “State welfare officials are concerned that the new requirements will be costly to the states. The Bush administration provided an additional $500 million for child care over the five-year program, a fraction of the $4 billion that the nonpartisan Congressional Budget Office said was necessary for parents to meet the new work requirements” [10 ].
The proponents of the work-for-welfare scheme argue that this will help the poor by weaning them off the system and thereby making them more self-reliant. But assuming that it was possible for all these people to find full-time work, they still would be living in poverty, since the actual value (purchasing power) of the minimum wage is at its lowest level since 1955. Two working adults, let alone a single parent, can not afford to pay for housing, child care, health care and transportation with working for minimum wage.
According to Economic Policy Institute “today, the minimum wage is 31% of the average hourly wage of American workers, the lowest level since the end of World War II” [11 ]. It is clear that the poor will have severe problems in alleviating their economic condition by simply working for minimum wage. If they work hard they may be able to join the working poor.
The government can only reduce services to the poor. It can not raise any money in from of taxes from this group.
b. The Second Quintile
The working poor families are those families that earn $34000 per year. According to a 2005 report by the Urban Institute, over 13 million families including 26.5 million children are living at the edge of the poverty (median income = $38000). According to this study “many children today are growing up in families with low incomes and with a parent working a substantial amount. The picture we have drawn here is one of low-income families with relatively high work effort at low wages, with jobs that often do not provide basic benefits, and with expenses roughly in line with their incomes. A subset of these families is experiencing material hardships related to food, housing, and health care, and many children in these families are not doing well on a range of measures. The economic circumstances of low-income families in part reflect their lower levels of educational attainment and poorer health (which could itself be a consequence of economic circumstances) than those families on the next rung up the economic ladder” [12 ].
Any increases in taxes or reduction in services will push (in reality) most of these people into the first quintile.
c. The Middle and Fourth Quintile
There is no agreed upon definition of Middle Class. Some such as Washington post consider those that earn from $40000 to $90000 [13 ] to belong to the middle class, while others consider any family that have an income of $20000 to $90000 as middle class. Here since we use the Congressional Budget Office’s quintile system, we combine the middle and fourth quintile to define our middle class group. Then according to this classification a middle class family is a family whose income is between $51900 and $77300 per year.
The middle class is considered the backbone of the consumer society. Their health and wealth is extremely important to the economy. They tend to be better educated than the lower quintiles, healthier and more politically engaged. Their size and economic health determines the prosperity of the nation.
When one looks at the income of a middle class family one would expect that at least this group would be in a good financial position. But all the reports point to the contrary.
The middle class is squeezed from all sides. The costs of housing, healthcare, transportation and education for the kids, have skyrocketed; making it exceedingly difficult to make ends meet.
According to the Department of Housing and Urban Development (HUD), "affordable housing" should cost less than 30% of a family's income, either in rent or a monthly mortgage. Yet many middle class families have to pay much more of their disposable income for housing. “From the end of 1994 to the end of 2004, housing prices rose 46 percent faster than overall inflation. In the period of a weak labor market, from March 2001 through the end of 2004, housing prices outpaced overall inflation by 25 percent” [14 ]. Many people own only the home that they live in. The rising house prices don’t really help these people, except in allowing them to re-mortgage their homes to raise extra loans; which eventually they have to pay back. If they sell their homes and move to a cheaper neighborhood, they can earn a good profit, but almost no-one does that. So if majority of the middle class only own the homes that they live in, the rising house prices do not really help them. On the contrary it creates the illusion of wealth, encouraging these people to borrow more and spend more. Eventually these loans have to be paid back, and when that time comes, most people find it hard to manage.
Do the middle class families face more hardship now that they did before? According to Harvard Law School Professor Elizabeth Warren they do. According to her “more and more families today are sending both parents into the workforce – it has become the norm, it is what we now expect. The overwhelming majority of us do it because we think it will make our families more secure. But that's not how things have worked out. By the end of this decade, one in seven families with children will go bankrupt. Having a child is now the single best predictor of bankruptcy, and this holds true even for families with two incomes.
So we looked at the data for two-income families today earning an average income. What we found was that, while those families certainly make more money than a one-income family did a generation ago, by the time they pay for the basics -- an average home, a health insurance policy, a second car to get Mom to work, child care, and taxes -- that family actually has less money left over at the end of the month to show for it. We tend to assume with two incomes you're doubly secure. But if you count on every penny of both of those incomes, which most families today do, then you're in big trouble if either income goes away. And obviously, if you have two people in the workforce, you have double the chance that someone will get laid off, or double the chance that someone could get too sick to work. When that happens, two-income families really get into trouble, and that's how a lot of families quickly go bankrupt” [15 ].
This group (i.e. the middle class) will be the one that will be the hardest hit of all groups. They will see their disposable income reduced substantially. On one side they will have to pay higher taxes, while they have to pay more for government services that were previously either free or subsidized. Many will have difficulty paying their debts (mortgages, etc) and will have to reduce their living standard substantially to stay solvent.
d. The Highest Quintile
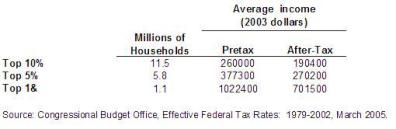
The highest quintile represents the top earners of the society. But it would be wrong to look at the average income of this group as the representative income for the whole group, because, unlike the other quintile, there is a very large difference between the top 1% and the rest of the group. According to the Congressional Budget Office (CBI), in 2003, the top 1% had an average income of $1,022,400 while the top 10% earned a quarter of the top earners or $260,000. In any other quintile, if you divide the average by 4, the resulting figure would be in a lower quintile. So here we shall look at the data provided by CBI for the top 16%.
In the past few decades we have seen a huge increase in inequality in America. According to the Economic Policy Institute, a Washington think-tank, between 1979 and 2000 the real income of households in the lowest fifth (the bottom 20% of earners) grew by 6.4%, while that of households in the top fifth grew by 70%. The family income of the top 1% grew by 184%—and that of the top 0.1% or 0.01% grew even faster. Back in 1979 the average income of the top 1% was 133 times that of the bottom 20%; by 2000 the income of the top 1% had risen to 189 times that of the bottom fifth. “Once all income sources are taken into account, including capital gains, the extent of income concentration at the end of the last business cycle was remarkably high by historical standards. Using newly available income data that goes all the way back to 1913, income in 2000 was only slightly less concentrated among the top 1% of households than during the run-up to the Great Depression, which was the worst period of uneven income concentration in the last century. In 2000, the top 1% held 21.7% of total income, compared to 22.5% in 1929” [16 ]. Since 2000 the inequality has only increased. According to Center on Budget and Policy Priorities (CBPP), the after-tax income of the rich has been increasing at an alarming rate. From 1979 to 2002 the after-tax income of the top 1% increased by 111% while 96% saw a very modest increase; with the poor and the working poor seeing only 5% and 12% increase in their disposable income.
The inequality in income has been made worse by President Bush’s tax-cuts for the rich. Gene Sperling the former President Bill Clinton's top economic adviser, in an article in Bloomberg, condemned the tax cuts, arguing that:
“While some middle-class tax relief -- and additional temporary tax cuts to stimulate the economy after the recession of 2001 -- was warranted, it is hard to justify the enormous windfall that President George W. Bush is seeking to bestow permanently on the very Americans who have been doing so much better than 99 percent of the rest of the populace.
Analysis of new Internal Revenue Service data by New York Times tax reporter David Cay Johnston found that those making $1 million a year collect 43 percent of all the new investment tax cuts. Those making more than $10 million have collected about $500,000 in tax relief -- a take he says will likely climb in the years to come.
The fiscal impact is just as striking. If the president's tax cuts are made permanent in the next decade, the top 1 percent of earners (who make about $400,000 today) will collect more than $1 trillion in new tax cuts. Those making more than $200,000 in today's dollars will take in a whopping 40 percent of all the recent tax relief during the next decade” [17 ].
Who Will Pay the Piper
It is said that if you owe the bank $1000 dollars you are in trouble, but if you owe the bank $10 million dollar, the bank is trouble. Some politicians and economists like to use this example to brush-off this enormous problem. Their argument is to a certain extend valid. China and other emerging countries need US market for their goods; but how long will they continue financing a mushrooming trade and budget deficit. Somewhere along the way they would want their money back.
How about the pensioners? Who is going to pay for their pensions? Who is going to pay for health care, social security, unemployment benefits, maintenance of the infrastructure such as roads and bridges? We can argue that Chinese, Arabs, and others are willing to finance the trade deficit; but we can not expect them to pay for the American pensions or maintenance of the US infrastructure. According to the latest report (2005) by the American Society of Civil Engineers, US government needs to invest $1.6 trillion dollars to keep the system from falling apart[18 ]. This figure excludes the security costs. The truth is that at the end of the day it is the American people that have to pay. This will be in the form of higher taxes and reduced governmental services. In other words lower living standards.
The poor and the working poor do not have anything to give. Their contribution will be in form of statistics. The number of people living bellow poverty line will increase. They will suffer because they rely on many services that will be cut or reduced. The rich will always find some loop-hole to avoid paying the major part their share. Even if their wealth is reduced by 10%, they will see no hardship. This leaves us with the Middle class. This group will be hit the hardest. They will see their taxes and expenses increase simultaneously. A good portion will have to live on far less than they are used to. Many will work longer hours just to stay solvent. Many may also join the working poor. It all may sound rather apocalyptic but the numbers do not lie. Politicians may avoid this problem for now, but sooner or later someone has to pay the piper.
FOOTNOTES:
1. Bureau of the Public Debt, “The Debt To the Penny”2. Hodges Michael, Grand Father Economic Report Series
3. CIA Word Factbook, “Rank Order - Public debt”, 16 May, 2006
4. USA Today, “The looming national benefit crisis”, 5 October 2004
5. Bilms Linda, and Stiglitz Joseph E., “The Economic Costs of the Iraq War: An Appraisal Three Years After The Beginning of The Conflict”, Harvard University
6. Opensecrets.org: The Center for Responsive Politics, “MONEY IS THE VICTOR IN 2002 MIDTERM ELECTIONS” November 6, 2002
7. USINFO.STATE.GOV: International Information Program, “FINANCING PRESIDENTIAL ELECTION CAMPAIGNS”, USIA Electronic Journals, Vol. 1, No. 13, September 1996
8. US Census Bureau,2005 Annual Social and Economic Supplement (ASEC), the source of official poverty estimates.
9. National Coalition for the Homeless, “Why people are homeless”, 2201 P. St. NW ❜ Washington, DC 20037, June 2006.
10. Arizona Republic, “300,000 more must work under welfare plan”, Jun. 28, 2006
11. Economic Policy Institute, “Minimum Wage- Facts at a glance”, July 2006
12. Gregory Acs and Pamela Loprest, “Low-Income Working Families”, The Urban Institute, 2100 M Street, NW ,Washington, DC 20037. September 2005
13. Washington Post, “What is middle class? ”, November 30, 2003
14. Christian Weller, “For Middle-Class Families, Dream of Own House Drowns in a Sea of Debt”, Centre for American Progress, May 2005
15. Mother Jones, “The Two-Income Trap”, November 08 , 2004
16. Economic Policy Institute, “The State of Working America 2004-05”, Cornell University Press edition , January 31, 2005
17. Bloomberg.com, “A Disappointing Decade for Reducing Inequality: Gene Sperling”, April 12, 2006
18. American Society of Civil Engineers, “Report Card for America’s Infrastructure” 2005
Dr. Abbas Bakhtiar lives in Norway. He is a consultant and a contributing writer for many online journals. He's a former associate professor of Nordland University, Norway.
Bakhtiarspace-articles @ yahoo.no
 Keith Rankin: Has Sweden Become A De Facto Apartheid Narco State?
 Bruce Mahalski: Change In The Weather #194
 Binoy Kampmark: Dangers To The Fourth Estate - The 2026 World Press Freedom Index
 Richard S. Ehrlich: Strait Of Hormuz Blockades & Thailand's Land Bridge
 Keith Rankin: 'I Am A Semite'
 Binoy Kampmark: Show Me The Money - A Loutish Administration Confronts A Craven Congress