 Scoop has an Ethical Paywall


Signs Of Moderating Growth In Most Major Economies
The OECD Composite leading indicators (CLIs), designed to anticipate turning points in economic activity relative to trend, show signs of moderating pace of growth at above-trend levels in the OECD area as a whole and in most major economies.
The latest CLIs point to signs of moderating pace of growth at above-trend level in the United States, Japan and Canada. Similar indications have emerged in the United Kingdom and in the euro area as a whole, including Germany and Italy. In France, there are also signs of moderating pace of growth, with the CLI still below trend.
The CLIs for the major emerging-market economies point to diverging developments. Steady growth continues in China (industrial sector), and stable growth continues in India, whereas in Brazil the CLI continues to indicate slowing growth. Signs of moderating pace of growth have emerged in Russia.
Despite the gradual lifting of COVID-19 containment measures in some countries and the progress of vaccination campaigns, persisting uncertainties might result in higher than usual fluctuations in the CLI and its components. As such, the CLIs should be interpreted with care and their magnitude should be regarded as an indication of the strength of the signal rather than as a measure of the degree of growth in economic activity.
See the full release and the accompanying notes.
See the tables and charts in Excel.
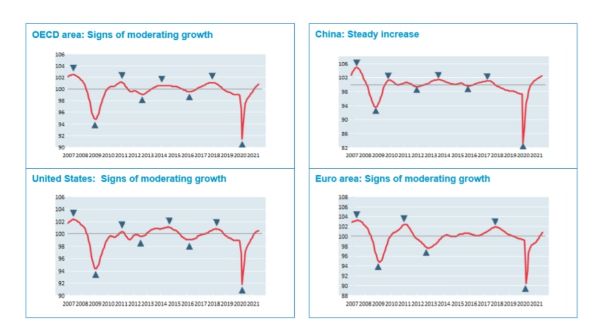
The above graphs show country specific composite leading indicators. Turning points of CLIs (marked by shaded triangles) tend to precede turning points in economic activity relative to trend by six to nine months. The horizontal line at 100 represents the trend of economic activity.
 UN News: Uncertainty Continues Over Safety In The Strait Of Hormuz
 Australian Museum: Celebrate Sir David Attenborough's 100th Birthday With The Australian Museum
 Clean Shipping Coalition: Shipping - IMO’s Net Zero Framework Progresses But ENGOs Slam Unnecessary Delay
 Gena Wolfrath, IMI: Understanding News Fatigue—and How To Stay Informed Without Overload
 Access Now: A Statement To Our Community About Why RightsCon 2026 Will Not Take Place In Zambia
 Climate Action Network: Santa Marta Plants The Seeds Of A Fossil-Free Future - Civil Society Will Hold Governments To Account