 Scoop has an Ethical Paywall


Xero (XRO.NZ) – Thoughts on Valuation
Xero (XRO.NZ) – Thoughts on Valuation
3 October 2013PDF Version
Listed on-line accounting Software as a Service (SaaS) play Xero (XRO.NZ) is a very interesting valuation case.
The company listed on the NZX in May 2007 with a market cap of NZ$55 million. The company really was a start-up – the IPO Prospectus lists zero total operating revenue in the nine months to 31 March 2007. The best sledge of the IPO process was: “Xero, first company named after its revenues”.
Today (October 2013), six and a half years later, Xero has a market cap of NZ$2.22 billion. Since the IPO the company has added over 200,000 customers, raised a total of NZ$146 million (includes pre-IPO and IPO cash), reached revenues of $39 million (annualised run-rate of $64 million) – but never made a profit.
• Xero is a high-growth technology company and not a Ponzi scheme.
• Losses are fine as long as value is being created.
• However – from a fundamental valuation perspective Xero is a challenge. First – there are a wide range of future potential growth scenarios. Second – we don’t know when Xero will move to being cash flow positive. From patient for profit and impatient for growth – to the reverse.
• Salesforce.com shows that the pursuit of growth for SaaS companies can go for a long time.
• While we have done fundamental analysis – this is like some economic models; interesting but potentially not grounded in reality.
• However – the market is valuing growth for both Salesforce.com and Xero and we can illustrate those relationships.
• Based on those relationships and our analysis of future Xero growth scenarios – the Xero value story may yet have a distance to go.
At the most basic level, in the near-term, Xero is all about the customer growth numbers.
Xero’s internal take (and checked by us) on their addressable market (New Zealand, Australia, United Kingdom and United States only) is approximately 33 million customers. That means two things:
1. Xero has reached a multi-billion dollar market capitalisation based on capturing a little over 0.5% of the addressable market; and
2. Despite the growth achieved to date – there is potentially a lot more to come.
In the New Zealand market – that is a pretty startling story. The bit that has a bunch of people really confused is the lack of “profit”. We hear (and read at NBR) comments about Xero being a Ponzi scheme (we particularly loved the Equiticorp reference in one comment). New Zealand investors are used to listed companies being stable, profitable, dividend-paying, corporate citizens. Xero doesn’t fit that expectation.
While Xero hasn’t been the usual listed company (start-ups don’t typically list anywhere). The growth path for Xero (including the losses) has been typical of successful start-up companies. This is how technology companies are built. Companies like Google (GOOG), Facebook (FB) and LinkedIn (LNKD) all took external investors’ money and suffered losses before generating profits and creating value; a lot of value. Xero is a high-growth early-stage company not a Ponzi scheme.
And yes – Xero does have competitors. There are large international accounting software firms like Intuit (INTU – EV: $US17.7BN), Sage (SGE.L – EV: GBP3.98BN) and MYOB (Private – 2012 revenues: $A212M). These players remain primarily traditional “shrink-wrapped” software providers. The SaaS model is very different to where they currently generate the majority of their revenues – and how their very large and very established businesses are set up to deliver their offering. While SaaS may be the future of their businesses, the Clayton Christensen disruptive innovation framework suggests it will be hard to reconfigure their
businesses even if they recognise it. If Xero’s competitors recognise the future is SaaS – their best response is probably to acquire Xero; while leaving the business independent and allow it to potentially cannibalise their historic businesses. An acquisition analysis of Xero (and there are a bunch of interesting issues there) is a whole other piece of work…
In corporate finance we say: “losses are fine as long as value is being created”.
What that means is – it is fine for a company to make losses in the short-term as long as those losses are building a platform to create enough profits in the long-term to provide an adequate return to shareholders.
In corporate finance that is analysed via a discounted cash flow (DCF) valuation – cash-flows from a business (positive and negative) are modelled into the future and used to calculate a present-value using a discount rate. This present value of future cash flows is the Enterprise Value (EV) of the business. For SaaS companies
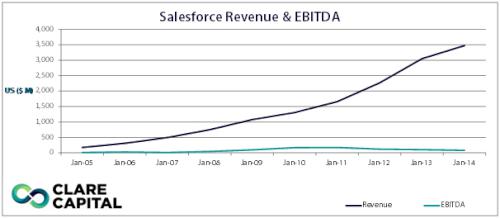
like Xero – this can be problematic. Where there is a big market opportunity– the losses (or investment) can go for some time. The most established listed SaaS company is Salesforce.com (CRM). This is their revenues and profit (EBITDA) since they listed in June 2004.
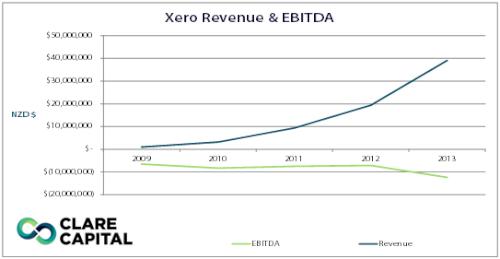
Here is Xero’s same numbers since 2009.
Salesforce.com, the most “established” listed SaaS company, is still chasing market share. Impatient for growth – patient for profit. If players like Salesforce.com are still prioritising growth – that may mean that Xero is going to be doing something similar for quite some time still.
Saleforce.com (CRM) has been a struggle for analysts to value using traditional measures – and Xero is the same. The valuation metrics for Salesforce.com have greatly moved around over time – with EV/Revenue the most applicable. Salesforce.com’s EV/Revenue has fluctuated between 2.4x (2009) and 14.0x (2006). The current EV/Revenue number is 9.0x. Intuit’s EV/Revenue is 4.7x; Sage’s EV/Revenue is 3.0x.
So how should we think about valuing Xero? There are three primary ways to value a company – and one related approach to take into account:
Economic – where a business’ value is related to how much cash it is expected to generate into the future, and the variability of these cash flows. This is done using a discounted cash flow (DCF) valuation model. This is really hard for Xero – because as Salesforce.com shows; the period of being impatient for growth and patient for profits can go for a long time. Xero is in a big market – and the company has the funding to chase that opportunity. Losses are fine as long as value is being created – but estimating when the positive cash flows will come is pretty tough.
Market – this uses market data (typically from listed company share prices and mergers and acquisitions transactions) of comparable peer companies to assess value. Finding comparators for Xero is also tough. Finding companies in similar markets, with similar business models and similar growth rates – isn’t easy. The EV/Revenue numbers for Salesforce.com show the challenges. Xero is currently trading at an EV/Revenue multiple of approximately 40x – is this too high or too low? That is a rhetorical question…
Accounting – this uses a Net Tangible Assets (NTA) approach. This isn’t very applicable for software companies as they don’t have many assets. Xero has NTA per share of $0.72. Let’s rightly just ignore that…
The related approach is how companies are valued in a capital raising situation. This often has little to do with fundamentals – and focuses on the returns that the investor is looking to achieve (typically as a multiple of their investment) based on what a company can be worth in the future. Xero investors like Peter Theil and Craig Winkler will have taken something of this approach when they invested. But these investors had more negotiating strength than typical retail investors (and rightly so). The returns a venture capital (VC) investor want – 5-20x the investment that they make – are also based on an uncorrelated fund portfolio that expects some investments to fail. VCs look for these high returns to off-set the expected losses in their portfolio and to generate a risk-adjusted return across the whole portfolio. Most retail investors are however not VCs.
A fundamental valuation approach
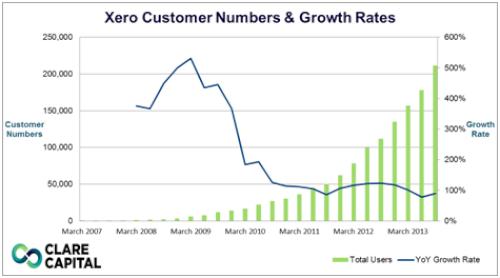
We are fundamental valuation guys – which typically means the economic or DCF approach backed up by comparator analysis. We have built a financial model of Xero – but recognise two things: First – we do not know what the growth is going to look like over the next couple of years. Second – we certainly don’t know when the cash flow numbers will turn from negative to positive; and recognise it may be some way off. We started with historic Xero customer numbers and growth rates.
To address the first issue – we have built a number of growth scenarios for Xero based on customer numbers. We see a worst case FY2017 customer number of 750,000 and best case 3 million.
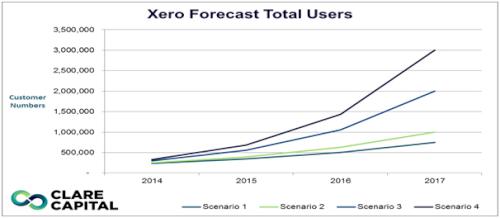
| FY yr/end 31 March | FY 2014F | FY2015F | FY2016F | FY2017F | |
| Scenario 1 Customer Numbers | # | 232,108 | 343,147 | 507,307 | 750,000 |
| CAGR 2014-2017 | % | 48% | |||
| Scenario 2 Customer Numbers | # | 249,416 | 396,232 | 629,470 | 1,000,000 |
| CAGR 2014-2017 | % | 59% | |||
| Scenario 3 Customer Numbers | # | 296,608 | 560,357 | 1,058,638 | 2,000,000 |
| CAGR 2014-2017 | % | 89% | |||
| Scenario 4 Customer Numbers | # | 328,250 | 686,294 | 1,434,881 | 3,000,000 |
| CAGR 2014-2017 | % | 109% |
The compound annual growth rate (CAGR) is important. It is the annual growth rate in customer numbers required to hit the 2017 number – from a 31 March 2013 number of 157,000 customers. Note that the historic year-on-year growth numbers have dipped below 100% for Xero.
From there we made some assumptions around profitability – based on a review of on-line/software companies. We used a negative 15% EBITDA margin in FY2014, breakeven in FY2015, 15% EBITDA margin in FY2016 and a 30% EBITDA margin in FY2017. We calculated WACC of 11.1% and a range of terminal growth rates for the various scenarios. This gave a range of valuations based on the scenarios.
| Scenario 1 | Scenario 2 | Scenario 3 | Scenario 4 | ||
| PV of Cash flows in Forecast Period | $ | 17,551,933 | 29,861,265 | 76,292,444 | 120,218,253 |
| PV of Terminal Value | $ | 585,945,135 | 869,193,495 | 1,887,247,834 | 3,460,096,967 |
| Enterprise Value | $ | 603,497,068 | 899,054,760 | 1,963,540,279 | 3,580,315,220 |
| Less: Net Debt | $ | (55,000,000) | (55,000,000) | (55,000,000) | (55,000,000) |
| Equity Value | $ | 658,497,068 | 954,054,760 | 2,018,540,279 | 3,635,315,220 |
| Number of Shares | # | 117,606,203 | 117,606,203 | 117,606,203 | 117,606,203 |
| Value per Share | $ | 5.60 | 8.11 | 17.16 | 30.91 |
Important point to note: As noted about Salesforce.com, Xero may choose (rightly) to chase market share (and incur losses) for a longer period than our forecasts suggest. These make our valuation numbers an interesting take – but like many economic models; potentially not realistic.
So taking all of this together – what can we take from a valuation perspective on Xero?
Xero has a big opportunity in front of the company – and like comparator Salesforce.com has decided to be impatient for growth and patient for profit. Xero has the available cash, and ability to raise more, that will allow this strategy to be pursued for a while yet.
From a valuation perspective – this high-growth approach makes it hard to value the company using a DCF approach. The reason for this is – we don’t know when the impatient for growth and patient for profit will spin around to patient for growth and impatient for profit. We do believe that if Xero decided to focus on profits over growth – the company would be highly profitable. However – the more customers that it can acquire before that stage, the better. Which is why the company is: impatient for growth and patient for profit. It is the right call.
From a comparator perspective – you can try to look for peers, but the circumstances of Xero (earlier stage than most listed companies and high-growth) make comparisons very hard.
Based on this we did take the analysis one more step. In our view from a fundamental valuation perspective – the key aspect for understanding Xero is the growth (which is why we developed the four growth scenarios). It also appears that the market is telling Xero that they approve of the growth strategy – and how it is being executed. So we looked a number of metrics to see if we could find some answers.
We pulled the historic enterprise value (EV) numbers for Salesforce.com and their historic revenue numbers (which are a good proxy for customers) and placed the EV on the y-axis and revenues on the x-axis. This was the result.
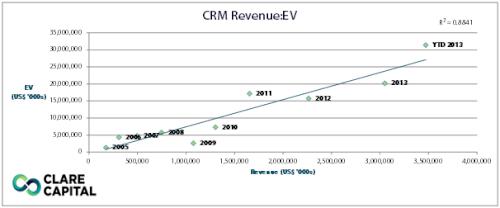
The graph above shows the revenue to EV for each of the financial years for Salesforce.com (CRM) for the year ended 31 January. The YTD 2013 value is calculated from the last four quarters back from the quarter ended 31 July 2013. The linear trend line shows the coefficient of determination (R2) of 0.8841 illustrating an extremely positive correlation between revenue and EV for Salesforce.com.
It is worth noting some of the detail in this analysis – in 2009 revenue was more than twice what it was in 2006; but the EV was lower. There is a trend – but there are also fluctuations.
What about Xero – doing the same analysis?
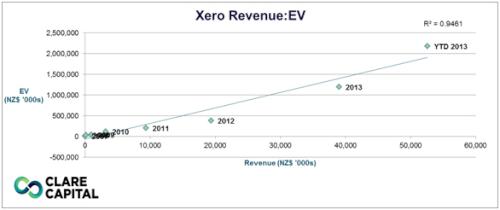
The graph above shows the revenue to EV for each of the financial years for Xero (XRO.NZ) for the year ended 31 March. The linear trend line shows the coefficient of determination (R2) of 0.9461 illustrating an extremely positive correlation between revenue and EV for Xero. Note – if we take out our estimate (YTD 2013) the coefficient of determination (R2) is even higher. The YTD 2013 value is calculated from the last four quarters back from the quarter ended 30 September 2013.
Interesting – there appears to be a correlation between revenue and EV. If we took the Xero trend line above and extrapolated that out for the various revenue numbers based on our scenarios (and our base revenue assumptions) – what would that imply for Xero?
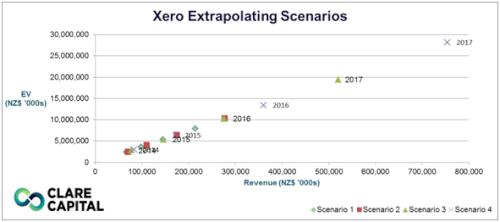
Remember EV is the value of the whole business. Market cap is EV less net debt (long-term borrowings less cash). For Xero, assuming no debt, EV is a pretty close proxy for market cap – cash would actually make market cap larger than EV. We have more detail here – but the graph is a good illustration.
Xero’s addressable market – per the company’s estimates is approximately 33 million businesses (covering only New Zealand, Australia, United Kingdom and United States). At our high-end estimate of 3 million customers in 2017 – that is less than 10% of that addressable market.
There is a pretty wide range of potential outcomes here – depending on the actual growth Xero achieves.
Clare Capital does not know what Xero’s future growth will look like – which is why we have employed the scenario approach that we have. Our analysis also ignores any future potential capital raising activities (like a NASDAQ listing). But this also shows that if Xero is able to continue to achieve growth – then, based on how the market has valued that growth historically, Xero’s value story may yet have a distance to go.
If Xero is not able to continue to grow at the rates it has achieved historically, and that we are forecasting, then we would expect there will be a material downward revaluation of the company. New Zealand investors in that situation would likely start to see the company make profits – but then be complaining about the share price drop. We are not expecting the growth to stop – but it is the biggest risk facing the company.
Xero announced they had reached 211,300 customers at the end of September 2013 – up from 157,000 at 31 March 2013. Continuing at that rate to 31 March 2014 puts Xero on pace for 265,000 customers. This is above our Scenario 2. Accelerating that rate further puts Scenarios 3 and 4 in play.
The table below outlines our estimates of customer numbers, revenues and EV’s based on the above regression analysis for each of the scenarios.
| FY yr/end 31 March | FY 2014F | FY2015F | FY2016F | FY2017F | |
| Scenario 1 | |||||
| Customer Numbers | # | 232,108 | 343,147 | 507,307 | 750,000 |
| Revenue | $ | 66,148,000 | 97,793,000 | 144,577,000 | 213,742,000 |
| Enterprise Value | $ | 2,419,130,000 | 3,606,338,000 | 5,361,501,000 | 7,956,324,000 |
| Scenario 2 | |||||
| Customer Numbers | # | 249,416 | 396,232 | 629,470 | 1,000,000 |
| Revenue | $ | 69,091,000 | 109,760,000 | 174,369,000 | 277,010,000 |
| Enterprise Value | $ | 2,529,518,000 | 4,055,292,000 | 6,479,196,000 | 10,329,902,000 |
| Scenario 3 | |||||
| Customer Numbers | # | 296,608 | 560,357 | 1,058,638 | 2,000,000 |
| Revenue | $ | 77,113,000 | 145,684,000 | 275,229,000 | 519,968,000 |
| Enterprise Value | $ | 2,83,0495 ,000 | 5,403,023,000 | 10,263,095,000 | 19,444,841,000 |
| Scenario 4 | |||||
| Customer Numbers | # | 328,250 | 686,294 | 1,434,881 | 3,000,000 |
| Revenue | $ | 82,493,000 | 172,473,000 | 360,600,000 | 753,930,000 |
| Enterprise Value | $ | 3,032,305,000 | 6,408,036,000 | 13,465,898,000 | 28,222,236,000 |
Xero is a fascinating company to have listed here in New Zealand. We really have seen nothing like it here before. It is very challenging from a valuation perspective – especially for retail investors. This analysis attempts to explain why Xero is a challenge from a valuation perspective – and while still respecting fundamental corporate finance principles lay-out a framework for thinking about the company.
Really simple conclusion
At the most basic level, in the near-term, Xero is all about the customer growth numbers.
DISCLOSURE: No Positions
Beyond This Analysis – Points To Consider:
• While there is no pressure to sell – and key decision-makers are focused on a home-run outcome; an acquisition of Xero is a possibility. There are a number of interesting potential acquirers. But what price would be required to entice Xero to sell? What number makes Rod Drury a billionaire (NZD or USD)?
• A US-listing (probably NASDAQ) is on the radar. That has some implications on valuation, available cash and US-profile.
• We are big Clayton Christensen fans – and like Xero’s position vs. incumbents. But could someone disrupt the disruptor?
Glossary
| Capital Expenditure (CAPEX) | Funds used by a company to acquire and maintain its physical assets. Rather than be treated as an accounting expense, this expenditure is capitalised and spread over the life of the asset. |
| Capital Structure | The relative mixture of debt and equity that finances the business. There are numerous classes of debt and equity, and the structure varies from firm to firm. |
| Discount Rate | The interest rate used in Discounted Cash Flow analysis to calculate the present value of future cash flows. This rate takes into account the time value of money (i.e. the notion that a dollar today is worth more today than a dollar tomorrow), and the risks and uncertainties associated with future cash flows. |
| EBIT | Earnings Before Interest and Tax. A measure of earnings that removes the impact of capital structure and tax loss positions generated by previous performance. |
| EBITDA | Earnings Before Interest, Tax, Depreciation and Amortisation. A measure of earnings that removes the impact of capital structure, tax loss positions generated by previous performance, and non-cash items depreciation and amortisation. |
| Enterprise Value (EV) | The value of the whole business, including debt and equity. |
| Equity Value | The value of the equity portion of the business. Calculated as Enterprise Value less Net Debt. |
| FY20XX | Financial Year 20XX. The financial reporting period for the business in question. If the business has a 31 March year-end then the FY20XX relates to the 31 March year-end corresponding to the year stipulated. |
| IPO | Initial Public Offering. The listing of a private company on a public stock exchange, allowing its shares to be bought and sold by public investors. Funds raised either go to the company, if it issues new shares, or to existing shareholders, if they sell into the IPO. Often IPOs consist of a mixture of the two. |
| Long Term Growth Rate | The rate at which a company’s cash flows are expected to grow in perpetuity. Because a company cannot experience real growth forever, this long term growth rate should not exceed the long term estimated rate of inflation, implying zero real growth in perpetuity. |
| Net Debt | The borrowings in the business, less cash and equivalents. Net Debt can be a negative figure if the cash and equivalents held by a firm exceed its borrowings. |
| Net Tangible Assets | A standard accounting measure of valuation. Calculated as Total Assets less Intangible Assets less Total Liabilities. Can be thought of a baseline to a valuation estimating what the business may be worth if it was liquidated. |
| Present Value (PV) | The value of anticipated future cash flows discounted back to their value today, using a discount rate. |
| Private Placement | A method of raising capital whereby a company sells a block of securities to a small number of investors. |
| Rights Issue | A method of raising capital whereby a company sells new shares, usually at a discount to the current price, to existing shareholders at a ratio dependent on the amount of shares they already own. |
| Terminal Value (TV) | The value of a company’s cash flows beyond the explicit forecast period, approximated by a perpetuity calculation. |
| WACC | Weighted Average Cost of Capital. The proportionally weighted sum of the cost of debt and the cost of equity. The WACC is the appropriate discount rate to use when valuing a company’s cash flows, as a mixture of debt and equity finances the assets generating these cash flows. |
| YoY | Year-on-year – a comparison with the preceding year. QoQ – quarter-on-quarter. PoP – period-on-period (period will be stipulated). |
About Clare Capital
Clare Capital is a Wellington-based boutique investment bank founded by Mark Clare.
Clare Capital adds value by:
• Originating ideas for clients.
• Assisting clients by completing analysis of issues.
• Assisting clients to complete commercial transactions.
Clare Capital provides advisory and transactional services across:
• Mergers & acquisitions (M&A) – combining detailed financial analysis with extensive M&A experience to help our clients maximize outcomes.
• Capital management – advising clients on their capital raising activities.
• Corporate finance – combining fundamental corporate finance principles with real-world practical experience to provide clients with: valuations, capital structure advice, and option and incentive schemes.
• Strategic advice – strategic and commercial advice to clients including: detailed strategic options analysis for clients facing key decisions and structuring and negotiating financial and commercial agreements.
--
Disclosures and
Disclaimers
This report has been prepared and issued by
Clare Capital Limited (Clare Capital). The information,
analysis and views in this report are for class advice
purposes only and do not constitute personalised advice
(whether of an investment, legal, tax, accounting or other
nature) to any person, and may not be suitable for all
investors. Before making an investment decision on the
basis of the information, analysis and views expressed in
this report investors should consider whether the
information, views and analysis are appropriate in light of
their particular investment needs, objectives and financial
circumstances. We recommend that investors should seek
advice from their usual financial advisor before taking any
action. This report has been prepared in good faith based on
information obtained from sources believed to be accurate,
reliable and complete as at the date of publication.
However, that information has not been independently
verified or investigated by Clare Capital. Clare Capital
does not, and cannot, make any representations or warranty
(expressed or implied) that the information is accurate,
complete or current, and Clare Capital excludes and
disclaims (to the full extent permitted by law) any
liability or responsibility for any loss which may be
incurred by any person as a result of that information,
including any loss of profit or any other damage, direct or
consequential. This report is intended for distribution in
New Zealand and in other jurisdictions where, under relevant
law, it may be lawfully distributed. This report is not
intended for distribution to any person in any jurisdiction
where doing so would constitute a breach of any relevant
laws or regulations. Copyright Clare Capital Limited 2013.
All rights
reserved.
 Stats NZ: Petrol And Diesel Prices Continue To Rise In April 2026
 Priority one: Regional Deal Strengthens Confidence In The Western Bay Of Plenty
 REINZ: Buyer Activity Softens As Living Costs Remain A Consideration Across Key Regions
 Better Taxes for a Better Future: Tax Policy Welcome Contribution, But Missed Opportunity To Tackle Wealth Inequality
 Google Threat Intelligence Group - GTIG: Google Threat Report Warns AI-Driven Cyber Operations Are Scaling Across Global Threat Landscape
 Commerce Commission: Baseline Research Report On The State Of Competition In New Zealand