 Scoop has an Ethical Paywall


Waiheke Council Comparison
16/03/15
Press Release: Our Waiheke Working Group
Council Comparison
The Our Waiheke Working Group (OWWG) has been looking at communities New Zealand-wide with similar populations and revenues to Waiheke Island to understand how they measure up on rates, revenue, spend, and management. OWWG has focused in on five communities ranging in population size from 7,536 to 12,033, from south to north – Gore, Waimate, Carterton, Stratford and Otorohanga - three of which have populations higher than Waiheke’s 8,340 (as at the 2013 census).
Out of all of these communities, Waiheke, while lower in population and with more modest amenities, has the highest income from rates and revenue. Waiheke also has the lowest kilometres of roading, and no water reticulation or significant sewerage infrastructure to maintain. Feasibly, Waiheke’s costs could be considerably lower than these comparable communities.
The compared councils spend on roads and water comprises between one third and one half of their overall revenues - between $5.6 million and $10.6 million. As Auckland Council has not made figures on the Waiheke spend publically available so, no direct comparison for this is possible, however it could be conservatively assumed that the roading and water spend is unlikely to come close Waimate’s $5.6 million - the lowest spend of the five councils.
The spread of figures for the different councils shows how widely population, revenue and expenditure can vary. Gore with a population of 12,033, has only 3000 more people than Otorohanga, but a very different revenue and expenditure. For example, two-thirds of Gore’s revenue ($13 million) goes on community needs other than water and roads, whereas Otorohanga spends nearly the same proportion ($10.6million) on water and roads leaving only $4.7 million for other expenditure for a population of 9,138.
The figures show that all the compared councils, regardless of their revenue or spend, come in on or under budget. The OWWG feels that these initial comparisons support the assumption that Waiheke Island would be in a strong financial position to pursue a case for independent governance.
The accompanying graphic shows some information provided by Auckland Council, some dating back to 2007, and not inflation adjusted. Auckland Council and Auckland Transport have not provided 2014 expenditure figures.
Other figures from websites:
www.goredc.govt.nz , www.stratford.govt.nz , www.otodc.govt.nz,
www.cartertondc.co.nz , www.waimatedc.govt.nz/home, Census 2013
Infographics_Council_Comparison.pdf
 Gordon Campbell: On The Risks Of AI In The Workplace
 Horizon Research: New Poll Finds High Concern About Fuel Situation
 Tiaki Wai: Over 1,150 People Give Feedback On Tiaki Wai Water Services Strategy
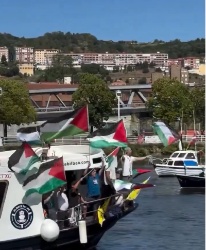 Greenpeace Aotearoa: Israeli Forces Illegally Attack Peaceful Humanitarian Flotilla
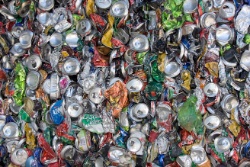 Zero Waste Network: Container Return Scheme Bill Could Save Councils $50m A Year And Put Money Back In Households
 Office of the Privacy Commissioner: Privacy Commissioner Does Not Support Policing Amendment Bill
 Foreign Affairs Defence and Trade Committee: Have Your Say On The International Treaty Examination Of The New Zealand—India Free Trade Agreement