 Scoop has an Ethical Paywall


Seasonal Climate Outlook (November - January): La Nina Is Here
Outlook Summary
• La Niña conditions have now emerged in the tropical Pacific.
• Both the Southern Oscillation Index (SOI) and the Relative Oceanic Niño Index (RONI) exceeded their respective La Niña thresholds for the month of October.
• More broadly, anomalies in ocean subsurface temperatures, atmospheric convection and circulation patterns across the Pacific are consistent with La Niña conditions.
• The coupling between the ocean and the atmosphere has been likely reinforced by a strong Madden-Julian-Oscillation (MJO) pulse that reached into the Maritime Continent at the end of October.
• Forecasts from Earth Science New Zealand’s (ESNZ) Relative Oceanic Niño Index (RONI) indicate a high probability (about 80%) of La Niña conditions prevailing during the November 2025 –January 2026 period. These new forecasts account for global warming trends in the tropics and are favoured by ESNZ. Traditional international guidance has around a 65% probability of La Niña conditions continuing through the forecast period.
• A minor Sudden Stratospheric Warming (SSW) event developed over Antarctica in September 2025, near the top of the atmosphere. The impacts of this SSW propagated
downwards towards through the troposphere (the part of the atmosphere where our weather occurs) throughout October, greatly influencing the unsettled conditions of the month. While a transition to other climate drivers, e.g., La Niña, is expected over the next three months, the SSW may continue to influence conditions during November.
• November will begin with the first period of prolonged, settled weather this spring as an anticyclone (high pressure) dominates. However, it’s likely this will not prevail throughout the entire month, with probable periods of rain from both the north and west. Despite this, a dry lean for the month is expected for most areas, with only the northern North Island at particular risk of running wetter than normal for the month.
• The latter half of the three-month period is expected to see high pressure sit more frequently over or south of the South Island, resulting in an easterly quarter anomaly airflow over the country. Westerly fronts should be reduced in frequency, and there is an elevated risk of lows from the north drifting onto the country.
• The threat for heavy rain makers from the sub-tropics and tropics will be elevated, with the North Island most likely affected by such events.
• The southwest Pacific Tropical Cyclone (TC) season has officially started, ESNZ Tropical Cyclone Outlook for November 2025 – April 2026 indicates a normal or elevated risk for ex TC interaction for New Zealand.
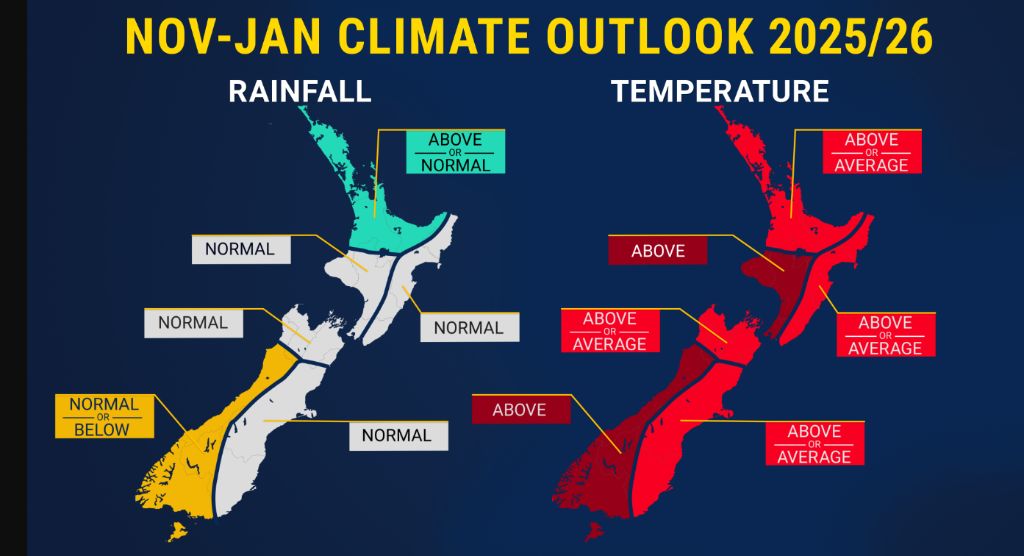
• Seasonal air temperatures are about equally likely to be near average or above average for all regions of New Zealand, except for the west of both islands, where above average temperatures are most likely.
• November – January rainfall totals are expected to be near normal or above normal for the north of the North Island, and near normal or below normal for the west of the South Island. Near normal rainfall is forecast elsewhere, though the tercile distribution, or probability for other outcomes, in these regions reflects uncertainty in the outlook.
• During November 2025 – January 2026, soil moisture levels and river flows are forecast to be below normal for the east of the North Island, and near or below normal for the north of the North Island and east of the South Island. Near normal soil moisture levels and river flows are expected for the remaining regions of the country.
• On top of the cooling seen in September, SSTs cooled further around parts of New Zealand during October 2025, ending the long running marine heatwaves (MHW) conditions off the west coast of the South Island. MHW conditions persist off the upper North Island and are likely to continue. Seas off the east coast of both islands are currently experiencing below average temperatures. Coupled General Circulation Model (GCM) forecasts suggest SSTs will be near or slightly above average for the remainder of the year, with warming expected later in the period, particularly off the east coast of the North Island. Monitor the SST update for updates.
Regional predictions for November 2025 – January 2026
The tables below show the probabilities (or percent chances) for each of three categories: above average, near average, and below average. In the absence of any forecast guidance there would be an equal likelihood (33% chance) of the outcome for any of the three categories. Forecast information from local and global guidance models is used to indicate the deviation from equal chance that is expected for the coming three-month period. All outlooks are for the three months averaged as a whole. During these three months, there will inevitably be relatively wet and dry periods, as well as hot and cold periods. The exact range in temperature and rainfall within each of the three categories varies with location and season. However, as a guide, the “near average” or middle category for the temperature predictions includes deviations up to ±0.5°C relative to the long-term mean, whereas for rainfall the “near normal” category lies between 80 percent and 120 percent of the long-term (1991-2020) mean.
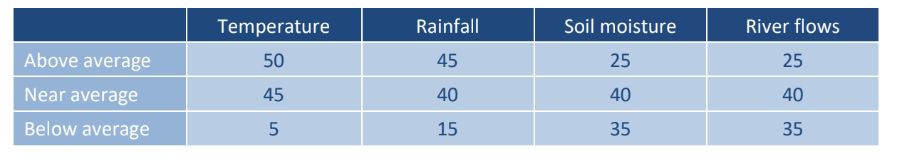
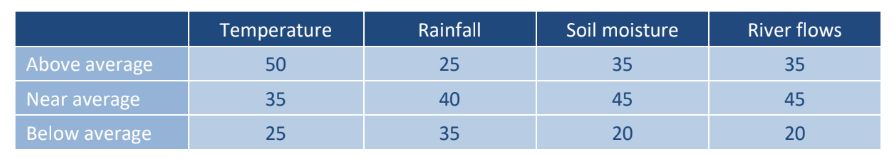
Northland, Auckland, Waikato, Bay of Plenty
• Temperatures are about equally likely to be above average (50% chance) or near average (45% chance).
• Rainfall totals are about equally likely to be above normal (45% chance) or near normal (40% chance). Rain events originating from, or having connections with, the sub-tropics and tropics may increase the chances for heavy rainfall events.
• Soil moisture levels and river flows are about equally likely to be near normal (40% chance) or below normal (35% chance).
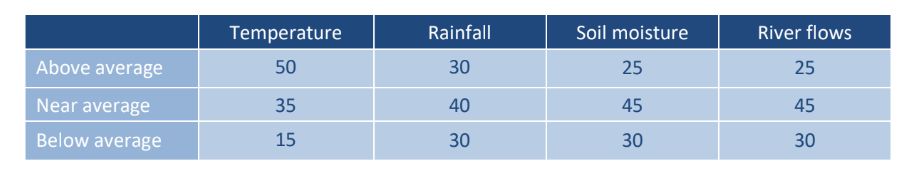
Central North Island, Taranaki, Whanganui, Manawatu, Wellington
- Probabilities are assigned in three categories: above average, near average, and below average.
• Temperatures are most likely to be above average (50% chance).
• Rainfall totals are most likely to be near normal (40% chance). However, the chances for either below or above normal rainfall (each 30%) are elevated, indicating a degree of uncertainty in the outlook. Rain events originating from, or having connections with, the sub-tropics and tropics may increase the chances for heavy rainfall events.
• Soil moisture levels and river flows are most likely to be near normal (45% chance).
Gisborne, Hawke’s Bay, Wairarapa
- Probabilities are assigned in three categories: above average, near average, and below average.
• Temperatures are about equally likely to be near average (45% chance) or near average (40% chance).
• Rainfall totals are most likely to be near normal (40% chance). However, the chances for either below or above normal rainfall (each 30%) are elevated, indicating a degree of uncertainty in the outlook. Rain events originating from, or having connections with, the sub-tropics and tropics may increase the chances for heavy rainfall events.
• Soil moisture levels and river flows are about equally likely to be below normal (45% chance) or near normal (40% chance).
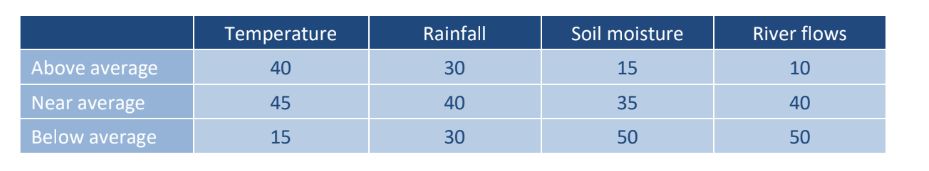
Tasman, Nelson, Marlborough, Buller
- Probabilities are assigned in three categories: above average, near average, and below average.
• Temperatures are about equally likely to be above average (45% chance) or near average (40% chance).
• Rainfall totals are most likely to be near normal (40% chance). However, the chances for either below or above normal rainfall (each 30%) are elevated, indicating a degree of uncertainty in the outlook.
• Soil moisture levels and river flows are most likely to be below normal (50% chance).
West Coast, Southern Alps and foothills, inland Otago, Southland
- Probabilities are assigned in three categories: above average, near average, and below average.
• Temperatures are most likely to be above average (50% chance).
• Seasonal rainfall totals are about equally likely to be near normal (40% chance) or below normal (35% chance).
• Soil moisture levels and river flows are most likely to be near normal (45% chance).
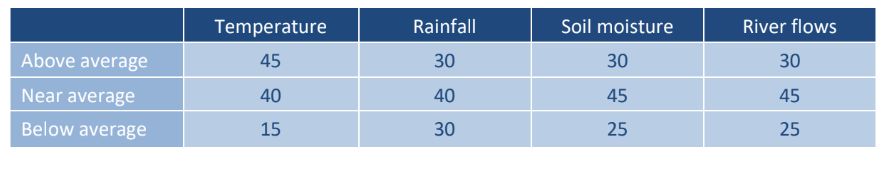
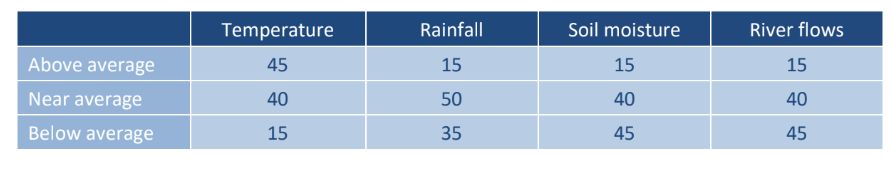
Coastal Canterbury and the nearby plains, east Otago
- Probabilities are assigned in three categories: above average, near average, and below average.
• Temperatures are about equally likely to be above average (45% chance) or near average (40% chance).
• Rainfall totals are most likely to be near normal (50% chance).
• Soil moisture levels and river flows are about equally most likely to be below normal (45% chance) or near normal (40% chance).
The full probability breakdown is:
 Gordon Campbell: On Children’s Book Classics - The Moomins
 Zero Waste Network Aotearoa: Container Return Scheme Bill Would Double Recycling Rates And Put Money Back In Households
 Wellington City Council: Statement From The Wellington Mayoral Forum On Options For Regional Governance Reform
 MUNZ: TAIC Report On Kaitaki Incident Gives Shocking Picture Of Decline Of NZ Maritime Infrastructure
 Greenpeace: New Climate Report Yet More Reason To Reduce Dairy Herd
 Better Public Media: Opposing Plans To Scrap The BSA
 Internal Affairs: Citizenship Test For Citizenship By Grant Applicants From Late 2027