 Scoop has an Ethical Paywall


New Zealand Cohort Life Tables: March 2026 Update
Cohort life tables track the mortality experience of people born in each year from 1876.
Key
facts
Cohort life tables give the most
authoritative measure of life expectancy because they follow
the mortality and survival of each birth cohort (people born
in a specific year) at each age until death of the last
survivor.
Projections of remaining mortality enable a cohort life table to be completed when a birth cohort still has people alive. Mortality projections are from National population projections: 2024(base)–2078 at: https://comms.communications.stats.govt.nz/ch/122749/1jq4m/538/Tht6oM9CKEJe6bNfyV88RV4WxqsP1nKxwbjD4cxJ.html
Life expectancy from the latest cohort life tables showed that:
- boys born in the late 1870s (the earliest data available) could expect to live to around 51 years on average, and girls to around 55 years
- boys born in the early 1960s (who are now reaching 65 years old) could expect to live to around 79 years on average, and girls to around 83 years
- boys born in the early 2020s (latest data available) could expect to live to around 89 years on average, and girls to around 92 years.
Visit our website to read the full information release and to download CSV files:
- New Zealand cohort life tables: March 2026 update: https://comms.communications.stats.govt.nz/ch/122749/1jq4m/539/Tht6oM9CKEJe6bNfyV88Ef1r0hpOygFEFdiJnwm0.html
- CSV files for download: https://comms.communications.stats.govt.nz/ch/122749/1jq4m/42/Tht6oM9CKEJe6bNfyV889v643hvO.SyUzn2vjSlE.html
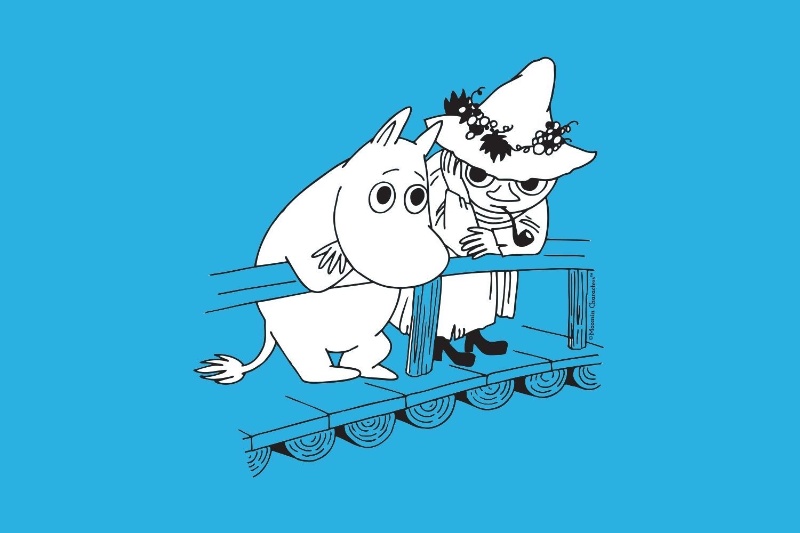 Gordon Campbell: On Children’s Book Classics - The Moomins
 Zero Waste Network Aotearoa: Container Return Scheme Bill Would Double Recycling Rates And Put Money Back In Households
 Wellington City Council: Statement From The Wellington Mayoral Forum On Options For Regional Governance Reform
 MUNZ: TAIC Report On Kaitaki Incident Gives Shocking Picture Of Decline Of NZ Maritime Infrastructure
 Greenpeace: New Climate Report Yet More Reason To Reduce Dairy Herd
 Better Public Media: Opposing Plans To Scrap The BSA
 Internal Affairs: Citizenship Test For Citizenship By Grant Applicants From Late 2027