 Scoop has an Ethical Paywall


Property Monthly Growth Rate Drops Back Below 2%
Tighter credit, reduced demand and the rising number of listings are set to act as headwinds for property value growth, says CoreLogic NZ Head of Research Nick Goodall.
CoreLogic’s House Price Index (HPI) found property values were up 1.8% over November, down from October’s rate of 2.1%.
The November reading shows a return to the trend of gradually easing property value growth, which has been in play since April this year, but was disrupted by the bounce in values in October.
In fact, the annual growth rate trimmed back to 28.4% at the end of November, down from 28.8% at the end of October. This is the first time the annual rate of appreciation has dropped since August 2020 when the market stalled following the first COVID-19 forced lockdown in April and May of 2020.
This slowdown reflects the natural loss in momentum after an extended period of strong growth, which has led to a deterioration in affordability, further impacted by rising interest rates and tighter credit conditions.
Looking ahead to 2022, this slowing momentum is likely to continue, especially with further tightening of credit. Fewer owner occupiers are able to secure high-LVR loans since 1 November, and from 1 December changes to the Credit Contract and Consumer Finance Act (CCCFA), which brings greater scrutiny of a potential borrowers’ expenses and ability to repay their loan, will further limit the amount of lending written by banks.
Add in the continued upwards trajectory of mortgage interest rates and some banks already implementing debt-to-income limits and it’s clear that demand for residential property will be negatively impacted as we head into summer.
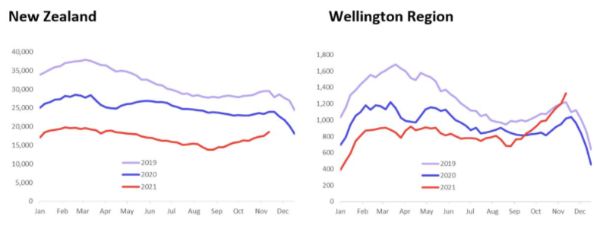
Meanwhile, rising listings volumes are also set to act as a headwind for property value growth. While on a nationwide basis there are still fewer properties available than at the same time in the last two years, the opposite is true in some regions.
The lift in advertised stock levels is most acute in both the wider Wellington region and the Manawatu-Whanganui region, where there are 30% and 33% respectively, more properties for sale now, than the same time in 2020.
Both the Hawke’s Bay (+22%), and to a lesser degree Southland (+2%), regions also have more properties on the market than this time last year.
Total listings (Source: CoreLogic)
This steep recent increase is not a reflection of an unusually high amount of properties being newly listed for sale, as the flow of new listings remains consistent with prior years, but is a result of fewer properties selling as buyers become less willing or able to pay the prices being asked by vendors.
At this stage vendors aren’t adjusting their price expectations, which leads to somewhat of a standoff as properties take longer to sell. The likely outcome will be seen in either downwards price adjustments from vendors or more properties being withdrawn from the market without selling.
The November HPI reveals most main centres saw a reduction in the monthly growth rate, with Dunedin the only city to see an increase, from 1.6% in October to 1.9% in November.
Property values in our largest city, Auckland, grew by a further 1.5% in November, although the annual rate of growth did slow slightly to 25.7% (from 26.3% in October). The average property value in Auckland has now surpassed $1.4m for the first time. Listings in Auckland remain -26% below the same time last year.
The average property value in Tauranga has now moved past $1.1m after rising a further 2.1% over November. The annual rate of growth appears to have plateaued at 35.8%, a record level, the same as at the end of October. Listings in Tauranga remain in short supply, tracking -11% below the same time last year.
Value growth in Hamilton further slowed over the month (+0.9%), however the quarterly rate of growth strengthened to 10.0%. Monthly value growth has been relatively mixed over the last six months in Hamilton, which indicates a certain degree of uncertainty in the market, perhaps reflective of a previously strong investor presence who are now faced with doubts on both current (yield) and future (capital growth) profitability. Listings in Hamilton are 8% above the same time last year.
In Christchurch, the quarterly rate of growth also hit 10.0% at the end of November – a record high. Similarly, the annual rate of growth (35.5%) broke the previous months’ all-time record. The average property value in the Garden City has now broken the $700,000 dollar barrier for the first time. Listings in Christchurch remain -25% below the same time last year.
The annual rate of value growth (21.8%) in Dunedin dipped away from October to November, however the market is still growing (+1.9% over November). There are 24% more properties listed for sale in Dunedin than a year ago.
Property value growth in Wellington City has slowed on all measures however values still increased by 1.0% over November. Wellington City has 15% more properties on the market today than it did a year ago.
Diversity in property market conditions is evident throughout the other main urban areas.
Property value growth in Queenstown continues to accelerate, despite an average value approaching $1.6m. Positivity regarding the borders re-opening may be contributing to renewed confidence in the tourism hotbed. Listings in Queenstown also remain very low, -36% below the same time last year, which will be contributing to the persistent growth in property values.
None of the other main urban areas included here have an average value above $1m, though both Lower Hutt (996k), and Porirua ($984k) are inching closer after 0.9% and 0.2% growth respectively. Similarly, Kapiti Coast has an average value in the high $900s ($973k) after a further 1.0% growth in November.
Listing volumes around the Wellington region have increased beyond previous years, with Lower Hutt (+71%) and Upper Hutt (+62%) in particular seeing a lot more available supply than last year. In Porirua there are 40% more properties available for sale than a year ago, while on the Kapiti Coast there are 12% more properties.
Both Napier (58%) and Palmerston North (54%), also have significantly more properties available for sale today than they did a year ago.
These areas where supply has materially increased recently may see reduced price growth in the coming months and the diverse conditions across the country illustrate the potential for mixed performances as potential buyers negotiate the tighter credit conditions noted earlier.
As the Reserve Bank has forecast, the official cash rate is likely to continue its upward trajectory (currently 0.75% after lifting 0.25% last week) throughout 2022, which will flow through to mortgage interest rate rises, further reducing the capacity of would-be-buyers to pay “yesterday’s prices”.
With a strongly performing economy and low unemployment, assisted by significant government support, we don’t expect the slowdown to result in material falls in property values.
Considering the strong cycle of growth, many home owners have accrued significant equity in their property and have been mortgage serviceability tested at higher interest rates so should be able to adjust to higher repayments. A shock which affects incomes would be of much greater concern to home owners and the government alike.
From a broader supply perspective, both the Electricity Authority’s reporting of new connections and CoreLogic’s tracking of completed new properties estimate that roughly 80% of consented properties go through to completion and thus add to overall stock levels.
Calculations of overall supply being sufficient for the current population, based on the recent reduction in net migration should therefore be tempered.
 Stats NZ: Economic Impacts On New Zealand From Conflict In The Middle East – Report
 Advertising Standards Authority: ASA Annual Report 2025 - Platform-Neutral Regulation Keeps Pace With Digital Advertising
 Science Media Centre: Lead Pipes Banned For New Plumbing – Expert Reaction
 New Zealand Young Physicists Trust: Auckland To Host The ‘World Cup Of Physics’ In 2027; Search Begins For Student-Designed Tournament Logo
 Oxfam Aotearoa: Top CEO Pay Increased 20 Times Faster Than Workers’ Pay In 2025
 Bill Bennett: TUANZ Report - Networks Built, Value Missing