 Scoop has an Ethical Paywall


Netflix Earnings Note: Q1 2023
One year after The Great Netflix Correction, with new leadership and old business models now in place, Netflix hopes to set a positive tone for itself and the rest of the industry with its Q1 2023 results.
Parrot Analytics data found a mixed bag for the streaming incumbent in the first quarter of the year. While it’s still number one by far, Netflix’s global share of demand for streaming originals hit another record low of 37.9% in Q1 2023. This is down from 55.7% in Q1 2020, when most of its current competitors either launched or were in their infancy.
That said, the overall demand for Netflix Originals did tick back up in Q1, growing 5.6% compared to Q4 2022, when the overall demand for Netflix Originals declined for the first time since Q2 2020. Global demand for originals from all other streamers grew 12.5%, more than double the pace of Netflix, explaining Netflix’s continued erosion in market share.
Netflix leads the pack in total catalog demand (all movies and TV series available on a platform) at 17.9% in the US. But that lead may not last long, as a full combination of HBO Max’s 14.4% and Discovery+’s 4.3% would hold an industry leading 18.7% in total catalog demand share.
Licensing Issues
One major theme of the last twelve months has been entertainment giants reverting to old business models, such as advertising and licensing. While Netflix Originals are still the most in-demand SVOD original programming worldwide and in the US, are they the most in-demand shows available on Netflix itself?
In Q1 2023, of the 25 most in-demand series available on Netflix with US consumers, seven were Netflix Originals. For context, 23 of the top 25 series available on HBO Max were HBO or Max originals. Only three of top 25 Netflix originals are owned in house — Stranger Things, The Witcher, and Warrior Nun. Several popular Netflix Originals that didn’t start on Netflix — like You, Cobra Kai, and Lucifer — as well as Netflix Originals not fully owned in-house could eventually revert back to the original owner, leaving a hole in Netflix's library.
The largest suppliers of Netflix’s most popular content are Sony TV, which produced six of the top 25 series on Netflix, and WBTV, which produced four. This potentially spells trouble for Netflix’s efforts to increase free cash flow medium and long term. If Sony TV is able to determine that Breaking Bad (#4 show on Netflix) and Better Call Saul (#6 on Netflix) are keeping high risk churn subscribers on the Netflix platform, then the rights holders can negotiate significantly higher licensing fees if Netflix wants to hold onto this high value content.
Netflix Originals vs All Other Streaming Originals
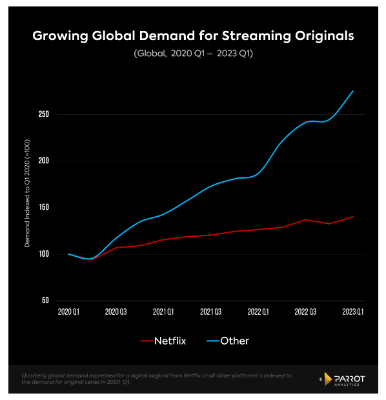
- Q1 2023 saw a return to growth in the streaming originals demand space, with the overall demand for Netflix originals up 5.6%, and overall demand for all other originals up 12.5%.
- In Q4 2022, the overall demand for Netflix Originals shrank by 4.1% compared to Q3 2022, which was boosted by record breaking demand for Stranger Things. This was the first decline in overall demand for Netflix Originals since Q2 2020.
- Because demand for original content is a key leading indicator of subscriber growth, this data suggests Netflix still has room to expand its base with its own original content.
- Since Q1 2020, the overall demand for Netflix Original Series is up 40.3%, while the overall demand for originals from all other streamers has increased by 175%.
Total Catalog Demand Share — US, Q1 2023
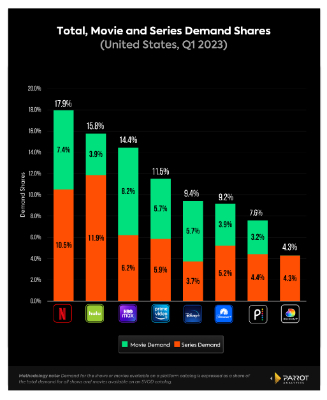
- While demand for original content drives subscription growth, library content is key for customer retention, an increasingly crucial element of all streaming strategies as the market matures and consumers are offered more choice and easier ways to cancel than ever.
- The catalog demand share data is a good indicator of which SVODs consumers are most likely to use as a default ‘streaming home.’
- Netflix continues to lead here, and grew its share significantly in Q1 2023, up to 17.9% compared to 16.6% in Q4 2022.
- While Hulu leads in TV catalog demand, and HBO Max leads in movies, Netflix’s strong second place in both categories catapults it to the top when everything is combined.
- However, Warner Bros. Discovery’s Max is poised to leap ahead of Netflix in total demand if all of Discovery+'s 4.3% is combined with HBO Max’s 14.4% when Max debuts in May.
Global Streaming Originals Demand Share
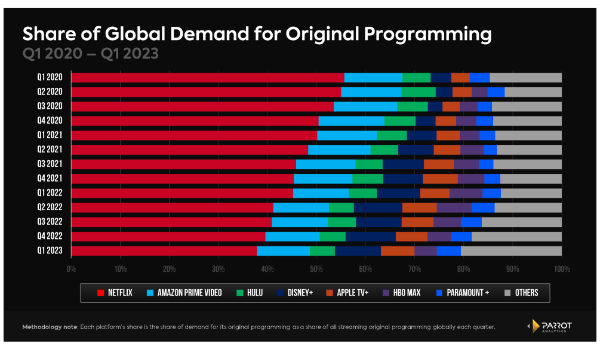
- From Q1 2020-Q1 2022, Netflix’s loss of global demand share came almost exclusively from the gains of three services: Disney+, HBO Max, Apple TV+.
- In the last twelve months, Netflix’s top six competitors — the above three plus Amazon Prime Video, Hulu and Paramount+ — have actually lost market share as a whole. In Q1 2022 those six accounted for 42.3%, but in Q1 2023 that’s down to 41.2%.
- So who is gaining market share? The “Others” category has steadily increased from 12.4% in Q1 2022 to 20.6% in Q1 2023, accounting for all of the market share losses of Netflix and its top six competitors.
- Dozens of local platforms from markets around the world, like iQiyi and Zee5, and niche American streamers such as AMC+ have carved out a collective one fifth of the global demand for original content as of the latest quarter.
Parrot Analytics
Global television demand measurement
Parrot Analytics is the leading global content demand analytics company for the multi-platform TV business. With the world's largest TV audience demand datasets, the company currently tracks more than 1.5B daily expressions of demand in over 100 languages from 200+ countries to reveal the content consumers engage with and watch the most across platforms.
As a trusted partner to some of the biggest media companies and content creators in the world, Parrot Analytics optimises content workflows in real time. The company's TV analytics products result in better production, distribution, acquisition and marketing decisions, as well as accelerated SVOD platform success.
 Bill Bennett: Fixed Voice Rules Head For Deregulation
 UN Department of Global Communications: United Nations Proposes New Global Dashboard To Measure Progress Beyond GDP
 Banking Ombudsman Scheme: Fraud Check Delays Well Worth The Inconvenience, Says Banking Ombudsman
 Asia Pacific AML: NZ’s Financial Crime Gap - Beyond The 'Number 8 Wire' Mentality
 Westpac New Zealand: Kiwi Households Adapting Despite Widespread Cost Pressure Concerns, Westpac Survey Shows
 University of Auckland: Kids’ Screen Use Linked To Long-Term Deficits In Self-Control And Attention