 Scoop has an Ethical Paywall


Seek Nz Employment Report - July
NOTE: The commentary, figures and tables in this report and all reports henceforth will refer to trend series data (not seasonally adjusted data as per previous reports).
*Applications per job ad are recorded with a one-month lag. Data shown in this report refers to June data.
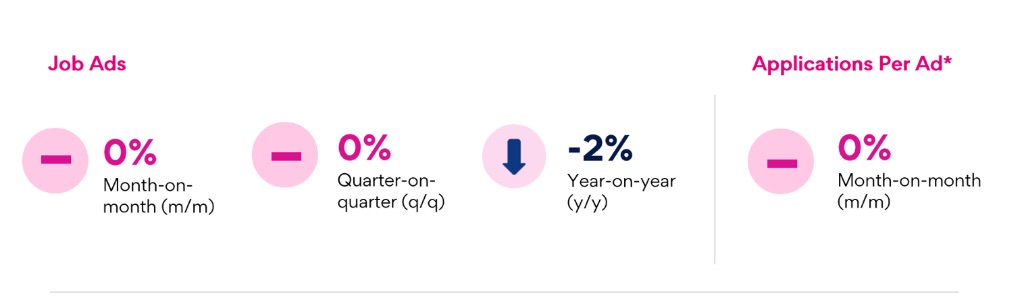
National Insights:
- Job ad volumes have remained unchanged for the past ten months.
- Ad volumes are now 2% lower y/y.
- Applications per job ad have not changed m/m.
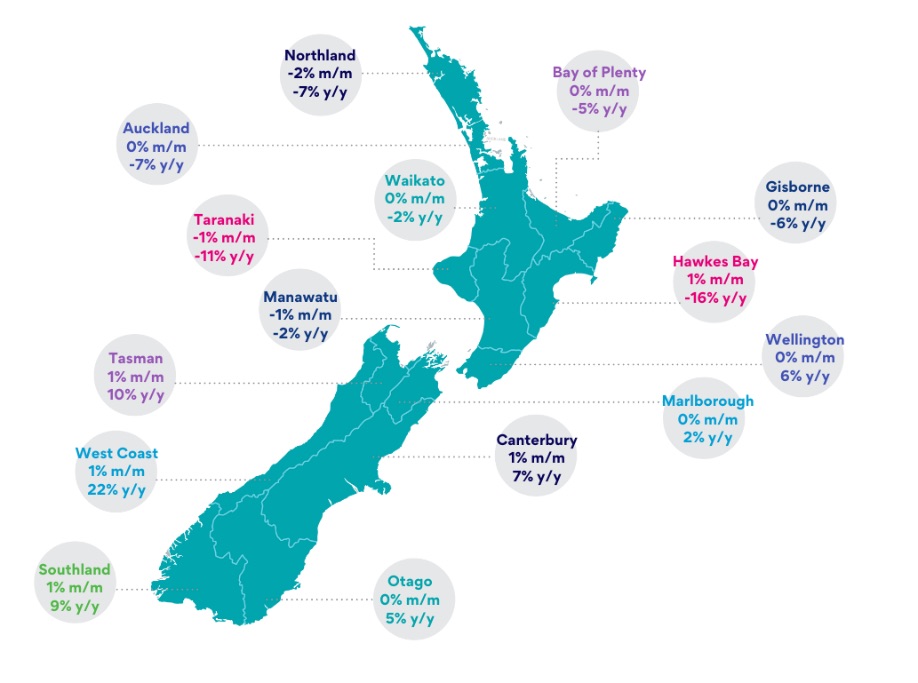
Region Insights:
- Ad volumes rose by 1% m/m in five regions, including Canterbury, Hawkes Bay, Southland, Tasman and West Coast.
- Among the regions where ad volumes have grown y/y are Canterbury (7%), Wellington (6%) and Otago (5%).
Industry Insights:
- Job ads in Information & Communication Technology have been rising steadily since November.
- Ad volumes within the Construction and Professional Services sectors grew by 1% m/m.
Rob Clark, SEEK NZ Country Manager, says:
“As the SEEK Employment Report
moves from using seasonally adjusted data to the trend
series data, we aim to better outline the overall changes in
the employment market, and with no change to ad volumes over
the past ten months, the trend is
clear.
“Ad volumes are at a low
but have stopped declining and we have seen very promising
growth within certain sectors, industries and regions
year-on-year.
"Worker demand in
Southland continues to grow, thanks to a rise in housing and
construction activity for the region, and this is being met
with rising interest among candidates.
“Nationally, the demand
for Information & Communications Technology workers has
been growing for eight months, and more recently, we have
seen an uptick in demand for Construction workers and
Engineers, which is something we can expect to continue with
big investment in the sector.”
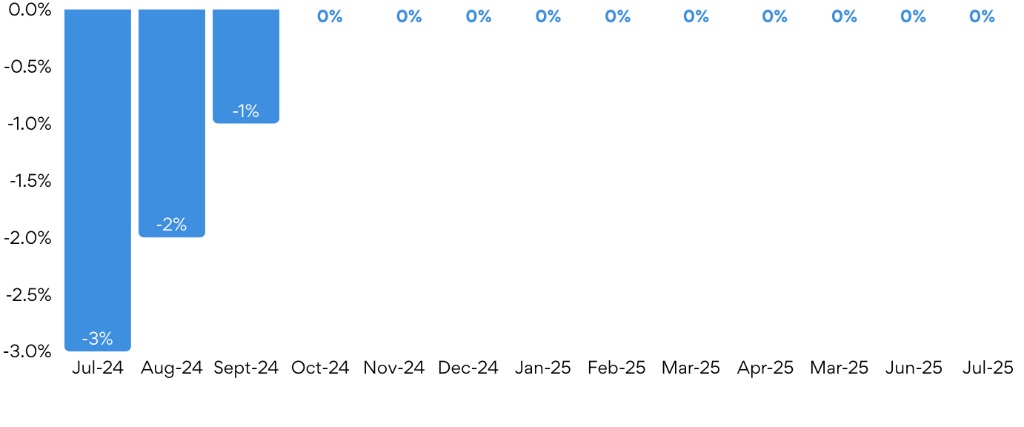
National Trends
Job ad volumes have not changed since
October, marking ten months of
stability.
Having declined 2% y/y, July marked
the slowest annual decline to be recorded since
pre-COVID.
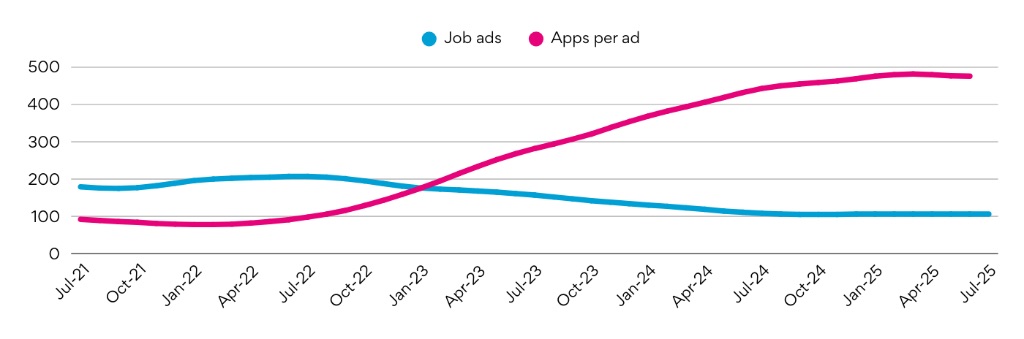
After dropping 1% in May,
applications per job ad did not change in June, meaning
levels are not at their highest peak, but do remain
extremely elevated.
Region Trends
There were 1% increases in ad volumes
in five regions m/m: Canterbury, Hawkes Bay, Southland,
Tasman and West Coast.
This marks the seventh
consecutive month of growth in Southland bringing the annual
rate to 9%. Ad volumes in Canterbury have also been steadily
increasing over time and are now 7% higher
y/y.
While ad volumes in Wellington have
remained steady the past two months, growth toward the end
of 2024 and start of 2025 has resulted in job ads 6% higher
than the same time last year.
Monthly ad
volumes in Auckland have not increased for three years, but
have remained steady for the past two months. The annual
rate of decline for the region has slowed to
7%.
Applications per job ad rose notably in
Southland (4%), in Taranaki (3%) and in Otago
(2%).
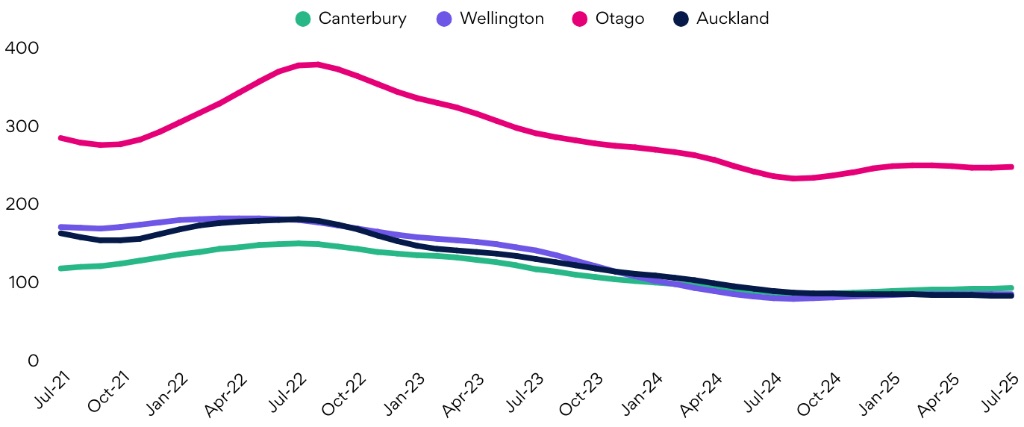
Index = 100 (2013 average). Photo/Supplied.
Industry Trends
The Construction and Professional
Services sector recorded growth in July, rising 1%
respectively.
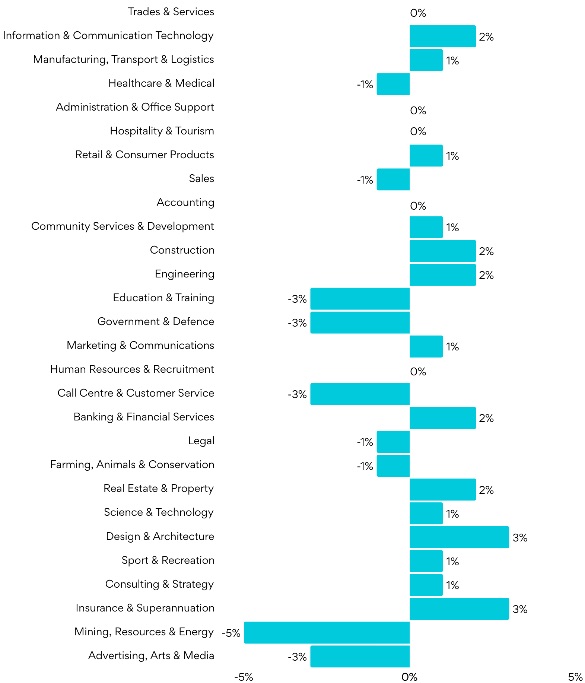
Within the Construction sector
the relatively small industry of Design & Architecture
rose 3% while both the Construction and Engineering
industries grew 2%. Demand for Construction workers in
particular has shown a steep rise since late 2024, up 13%
since September.
In the Professional Services
sector, demand for Insurance & Superannuation workers
jumped 3% m/m and has risen steadily over the past quarter.
Demand for Information & Communication Technology
workers has been growing since November 2024, and rose
another 2% in July. Ad volumes increased significantly over
the past year for Management (43% y/y), Software Engineers
(27% y/y) and Product Management & Developers (27%
y/y).
Job ads declined m/m in the Public Sector
(-1%) with Education & Training and Government &
Defence both falling 3%. After rising significantly during
the year to April, Government & Defence ad volumes have
since been declining slowly, but remain 23% higher y/y.
Community Services & Development are the only Public
Sector roles which grew in demand m/m, up 1%.
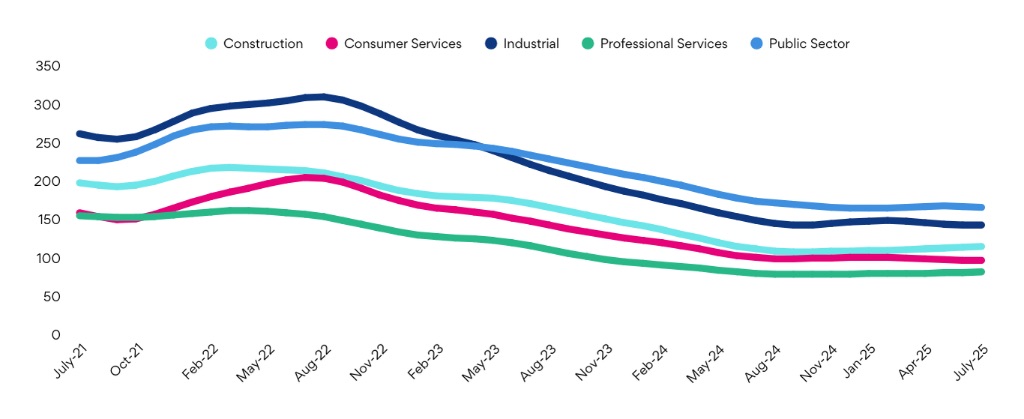
Index = 100 (2013 average). Photo/Supplied.
Notes:
(1)
From August 2025, all SEEK Employment Reports will refer to
the trend data series and not the seasonally adjusted data
series. The trend data series applies a
weighted moving average to the seasonal adjusted figures
(using a 13-term Henderson moving average) to smooth out
short-term fluctuations and noise. The trend data help
identify the longer-term direction by filtering out both
seasonal effects and short-term volatility.
(2) The SEI
may differ to the job ad count on SEEK’s website due to a
number of factors including: a) seasonal adjustments applied
to the SEI; b) the exclusion of duplicated job ads from the
SEI; and c) the exclusion of Company Listings (included
under Company Profiles) from the SEI.
(3) Caution is
recommended when interpreting month-to-month changes in
variables generated multiple trend breaks. trend estimates
during the COVID period as large month-to-month changes in
variables generated multiple trend
breaks.
 Priority one: Regional Deal Strengthens Confidence In The Western Bay Of Plenty
 REINZ: Buyer Activity Softens As Living Costs Remain A Consideration Across Key Regions
 Better Taxes for a Better Future: Tax Policy Welcome Contribution, But Missed Opportunity To Tackle Wealth Inequality
 Google Threat Intelligence Group - GTIG: Google Threat Report Warns AI-Driven Cyber Operations Are Scaling Across Global Threat Landscape
 Commerce Commission: Baseline Research Report On The State Of Competition In New Zealand
 University of Auckland: Junk Food Designed To Make Us Eat More, Study Finds