 Scoop has an Ethical Paywall


Kiwi Markets Play Copycat To Global Moves
- Offshore data and events drove financial markets last week. A hawkish dissent to the Fed rate cut and a hot Aussie inflation print saw expectations for further easing from the Fed and RBA pared back. That repricing found its way to Kiwi markets, with yields climbing in sympathy and the Kiwi dollar under pressure.
- The US and China have landed on a trade deal. The average tariff rate on Chinese imports will be reduced to under 50%. And in exchange, China will pause its control on rare exports and purchase more US soybeans, oil and gas. Question is: how long will this truce last?
- We really want to highlight our most recent podcast episode “Unlocking efficiency one robot at a time” where we join the team at DSL logistics to get the inside scoop on how cutting-edge robotics have transformed their Kiwi business.
Here’s our take on current events
We had a big week of international announcements and data. A lot of it coming from the US…
Highly anticipated trade talks between the US and China seemingly went well with President Trump even rating his meeting with President Xi a 12 out of 10. The two parties have agreed to a one year “truce”, alleviating trade tensions for now. Within the truce, China has agreed to forgo its export restrictions on rare earth metals, buy US soybeans, and undergo stricter export controls on precursor chemicals used in the production of Fentanyl. In exchange, Trump relaxed some of the tariffs on Chinese imports. The average tariff rate on China is now down to 45% (previously 55%). It’s a move in the right direction, and certainly a better outcome than the additional 100% tariff Trump threatened just a couple of weeks ago. But even at 45%, tariffs on China remain at levels that are likely to weigh on China’s growth. And subsequently continues to risk weighing on our own growth and recovery here at home.
Nevertheless, with that ticked off Trump’s list, we hope his attention turns to addressing the ongoing US Government shutdown. With every week that passes, the shutdown is estimated to deduct 0.1% of annualised GDP. And today marks day 33 of the shutdown, with the closure on the brink of becoming the longest shutdown in US history…
Movements in financial markets over the last week however were centred around the US Fed. The 25bps cut to the fed funds rate was as expected. But the decision came with two dissents. Governor Stephen Mirran opted for a 50bps cut – big shock (not). But the Kansas City Fed President Jeffrey Schmid voted for no change. The hawkish dissent was unexpected and seemingly supported by commentary from Fed chair J. Powell. In remarks during his press conference, Powell pushed back on a predetermined 25bps cut in December, commenting that a third consecutive cut was “not a forgone conclusion, far from it ”. Such comments saw a swift pare back in expectations for the December meeting with markets going from having over a 90% chance of a cut priced to just 50% priced in. As expected, the pullback saw US rates across the curve jump higher. Both the US 2yr and 5yr lifted ~10bps higher following the announcement and press conference.
Meanwhile in currency markets, the Kiwi lost some strength against the US dollar as expected. Shortly after the announcement the NZDUSD fell from around .5790 to .5752, with further falls to a low of .5715 in the days that followed. Currently the Kiwi Dollar sits in the low .5720’s at time of writing.
The repricing of Aussie rate cut expectations following a hot inflation print also spilt over to our markets. Aussie annual inflation printed above expectations, up 3.2% over the September quarter. The acceleration follows the unwind in energy rebates. The disinflationary force previously provided by goods inflation is also waning. At the same time, there’s persistent strength in services inflation which is still running at 3.5%.
Further confirming that the recent reacceleration is not being driven by one-off increases, measures of underlying price pressures also printed hot. Trimmed mean inflation lifted to 3% on the year, climbing to the top of the RBA’s 2-3% target band. The September inflation update is a hard one to look through, and will have to result in a higher inflation outlook. The RBA expected trimmed mean to fall to 2.6% by the end of the year. That looks unlikely now. Market reaction to the report was swift, with a strong sell-off in Aussie rates as a rate cut this week was priced out. Some local commentators have even called the end of the easing cycle. Kiwi rates rose in sympathy, with the 2year swap climbing about 20bps above the cycle low – although Friday saw some of that lift unwind.
Last week’s moves in Kiwi rates and currency were largely driven by offshore developments. There has been no change to the domestic economic outlook. We still expect the RBNZ to deliver another 25bps at the November meeting.
This week our attention turns to Stats NZ’s suite of labour market data out on Wednesday. We expect that conditions in the labour market loosened a little bit further over the quarter. In some good news, there are signs that the market is beginning to stabilise. 2026 should be a better year. But right here, right now, labour demand is not yet strong enough to absorb the extra supply entering the market. (See our full preview here).
We expect the unemployment rate to increase to 5.3% from 5.2% - the highest in over eight years. Though a key assumption to the rise in the unemployment rate is a continued drop in labour force participation. The participation rate soared to an all-time high of 72.4% in June 2023. A surge in migration supplied much needed work-ready migrants, and a cost-of-living crisis pulled many off the sidelines. But with waning demand, workers have headed for the exits. As such, we've seen a gradual decline in the participation rate. And we expect a further fall in participation from 70.5% to 70.4% - the lowest since Dec 2019.
At the same time, growing slack within the labour market should also see wage growth continue to moderate. We expect to see a 0.4% quarterly rise in wages, pulling down the annual rate from 2.3% to 2.1%.
Altogether the data should reinforce the need for further monetary policy easing. Downside risks to medium-term inflation are growing given the soft labour market and dimming global outlook. We continue to expect the RBNZ to cut the cash rate by 25bps at the November meeting.
Charts of the Week: Inflation’s uneven bite: Who’s hurting most?
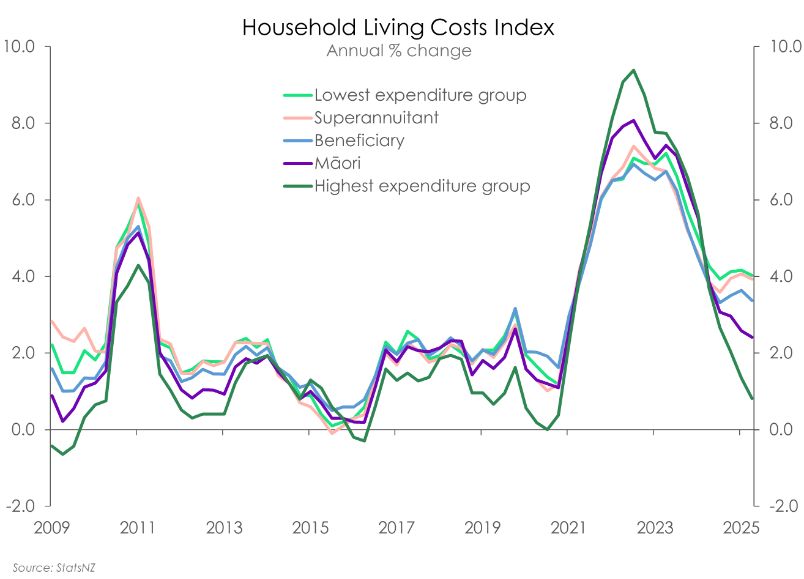
Inflation is hurting some more than others. It’s unfair. StatsNZ’s Household Living-Cost index showed that living costs for the average Kiwi household continue to ease. But there is a widening gap across different Kiwi households.
Living costs for the average Kiwi household were up 2.4% in the year to September 2025, down from 2.6% last quarter. But for households in the highest expenditure group, costs rose just 0.8%. In contrast, those in the lowest expenditure group, saw costs rise by 4%. Households that spend the least, and have the tightest budgets, are experiencing the highest inflation.
The disparities don’t stop there. Superannuitants and beneficiaries are also feeling the pinch with living costs rising 3.9% and 3.4% respectively. Māori households are faring a bit better, with living costs up a shallower 2.4%. But that’s still 3 times above the increase of those amongst the highest spending households.
Interest rates have been the leading driver behind the story of who’s paying the most. From the sharp rise over 2022-23, to the steep declines over the past year.
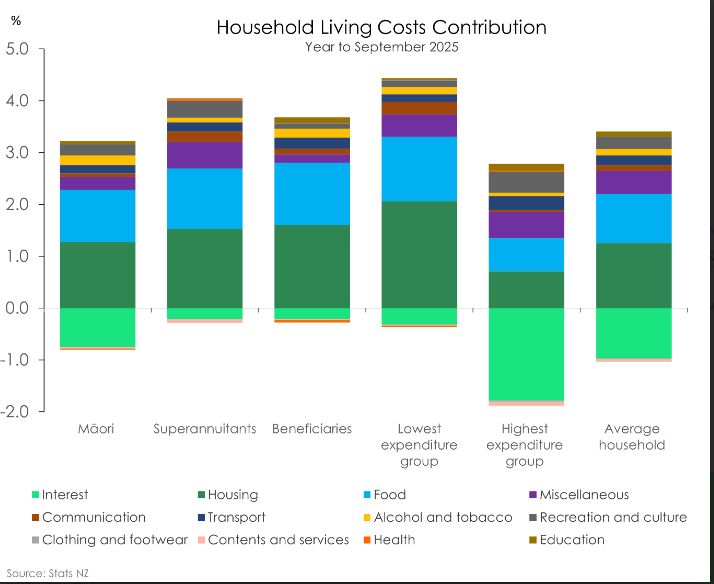
With interest rates now falling, interest repayments are down 14.3% for the average household. It’s a move which has had a sizeable impact in reducing living costs across all Kiwi. But one which has been felt most by households amongst the highest expenditure group as higher carriers of debt.
For households within the highest expenditure group, interest repayments hold a 12% weighting towards their cost of living. That’s almost double that for the average household (6.8%). So when interest rates were rising, they were hardest hit. Now, the move down is providing relief. Interest repayments have fallen close to 15%. It’s the reason why these households are recording the lowest annual inflation, deducting as much as 1.8% from their cost of living.
For other groups, particularly superannuitants and beneficiaries, the fall in interest repayments, have had less of an impact. Repayments hold less than a 2% weighting for both groups. Simply because these households are less exposed to holding mortgages. For example, according to Stats NZ, just 8.5% of Kiwi retirees have a mortgage.
All households are feeling the pinch of rising costs across the housing and food groups. No surprises there. Both housing and food are two areas where the Consumer Price Index has flashed sizeable increases in prices over the past year. But within housing, where most of the inflation heat is coming from, separate subgroups are driving up living costs across Kiwi households.
 Asia Pacific AML: NZ’s Financial Crime Gap - Beyond The 'Number 8 Wire' Mentality
 Westpac New Zealand: Kiwi Households Adapting Despite Widespread Cost Pressure Concerns, Westpac Survey Shows
 University of Auckland: Kids’ Screen Use Linked To Long-Term Deficits In Self-Control And Attention
 University of Auckland: Research To Address Equity In STEM For Māori, Pacific And Female Students
 Stats NZ: Economic Impacts On New Zealand From Conflict In The Middle East – Report
 Advertising Standards Authority: ASA Annual Report 2025 - Platform-Neutral Regulation Keeps Pace With Digital Advertising