 Scoop has an Ethical Paywall


Spring Market Hits Next Gear As Buyer Activity And Listings Soar
The number of properties listed for sale has surged with new listings onsite hitting a four year high in October, according to the Trade Me Property Pulse Report.
New property listings in October were up 29 per cent from September and 3 per cent year-on-year, to the highest levels since late 2021.
The surge in new inventory coincides with growing demand, which is up 11 per cent month-on-month and more than 18 per cent compared to October 2024.
Trade Me Property Customer Director Gavin Lloyd says the numbers point to an active market, and growing confidence as we head towards summer.
“It’s awesome to see the property market firing on all cylinders in October, proving that the spring selling season is well and truly underway,” says Mr Lloyd.
“Buyers appear to be feeling the confidence that comes with more choice too as we’ve seen strong demand both compared to September and year-on-year.”
Supply and demand by region
In the major centres new listings in Auckland are up 4 per cent year-on-year and 33 per cent from September. Wellington saw a 6 per cent jump in new inventory onsite between September and October and 33 per cent compared to October last year. New listings across Canterbury are also up 5 per cent month-on-month and 20 per cent year-on-year.
Demand, measured by searches, is also up across the three regions. Month-on-month demand is up 10 per cent in Tamaki Makauru, 15.5 per cent in Wellington and 7.9 per cent in Canterbury. Year-on-year growth in Auckland and Wellington has grown between five and 10 per cent and in Canterbury close to 31 per cent.
Outside of the main cities, Northland and Marlborough also saw a flurry of new property listings from September, up 49 per cent and 43 per cent respectively.
Demand is also strong across the two regions, up 15 per cent month-on-month in Northland and 22 per cent in Marlborough. When compared to October 2024 Northland demand is up 42 per cent, while Marlborough climbed 11 per cent.
Asking prices up across the motu
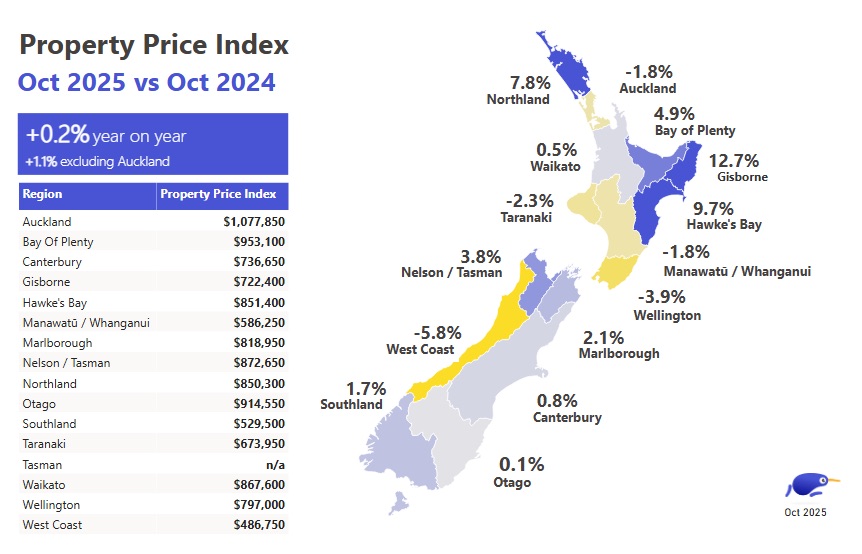
The national average asking price in October was $883,200, a 6 per cent increase - or nearly $48,000 from September, and flat (0.2%) year-on-year.
"We’ve now seen three straight months of positive growth in the average asking price, with the increase between September and October the biggest month-on-month jump since January.”
Trade Me’s Property Pulse Report shows the average asking price increased in 12 of the 15 regions Trade Me monitors between September and October, with Southland (-2%) the West Coast (-1%) and Taranaki (0%) the only exceptions.
Gisborne (+17%) Hawke’s Bay (+13%), Marlborough (+13%), Northland (11%) and Bay of Plenty (+10%) all saw double digit growth in the average asking price month-on-month.
Days onsite tumble
The number of days properties spent onsite is also down from a median of 65 days in September to 57 in October.
“Not since March have we seen days onsite this low, indicating a more balanced market than the one which has, in more recent months, tended to favour buyers.”
About the Trade Me Property Pulse Report:
The Trade Me Property Pulse Report measures trends in the expectations of selling prices for residential property listings added to Trade Me Property by real estate agents and private sellers over the past months.
It provides buyers, sellers and realtors with insights into ‘for sale’ price trends by property type and property size.
The Index is produced from data on properties listed on Trade Me Property in the past month. The Index uses an “80 per cent truncated mean” of the estimated property value to calculate the average asking price. This excludes the upper and lower 10 per cent of listings by price, and averages the expected sale prices of the remaining properties.
It provides an insight
into ‘for sale’ price trends by type and size of
property. Other reports aggregate property price data across
these various properties.
Some of the numbers
in this release have been
rounded.
 UN Department of Global Communications: United Nations Proposes New Global Dashboard To Measure Progress Beyond GDP
 Banking Ombudsman Scheme: Fraud Check Delays Well Worth The Inconvenience, Says Banking Ombudsman
 Asia Pacific AML: NZ’s Financial Crime Gap - Beyond The 'Number 8 Wire' Mentality
 Westpac New Zealand: Kiwi Households Adapting Despite Widespread Cost Pressure Concerns, Westpac Survey Shows
 University of Auckland: Kids’ Screen Use Linked To Long-Term Deficits In Self-Control And Attention
 University of Auckland: Research To Address Equity In STEM For Māori, Pacific And Female Students