 Scoop has an Ethical Paywall


Housing Market Holds Steady As Global Tensions Weigh On Confidence
New Zealand’s housing market remained resilient through March, with buyers continuing to transact despite the onset of the Iran conflict and a sharp rise in petrol prices.
Data released today by the Real Estate Institute of New Zealand (REINZ) in its Property Report for March 2026 shows sales activity was essentially unchanged year-on-year, while prices remained broadly stable – a result that reflects a market absorbing a global shock rather than retreating from it.
Every transaction captured in the March data was made during the first full month of the conflict, as fuel prices climbed above $3.30 per litre and consumer confidence fell sharply. Despite this, buyers remained active across much of the country.
“March shows a housing market holding its nerve. Despite rising fuel costs and global uncertainty, buyers didn’t step away, but they are becoming more cautious and taking longer to make decisions,” REINZ Chief Executive, Lizzy Ryley, said.
“That caution is reflected in the numbers. Sales were essentially flat year-on-year at 7,853, and while prices remain stable, the seasonally adjusted figures show a slight dip in activity. It suggests buyers are still active, but are more measured, responding to cost pressures rather than stepping away from the market,” she said.
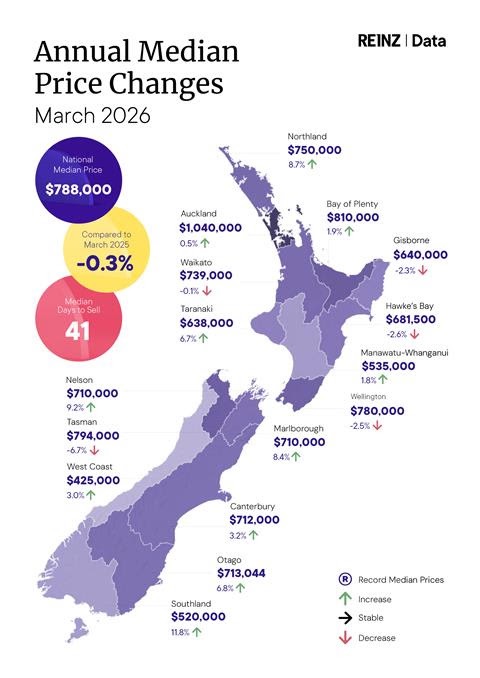
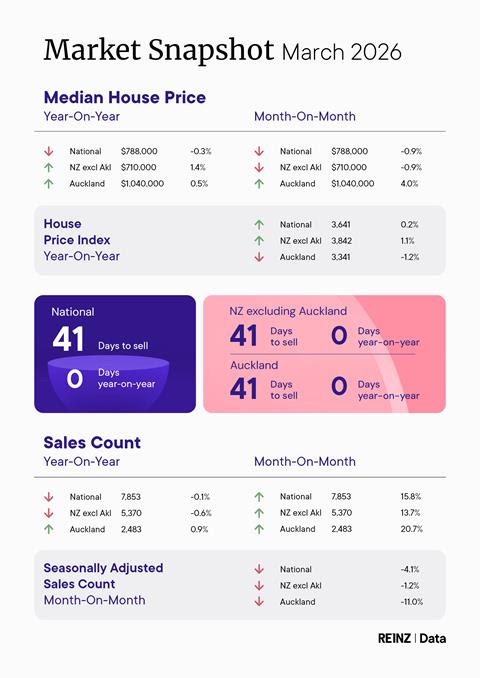
Nationally, the figures point to a market that remains stable, but not uniform. The median price eased slightly by 0.3% year-on-year to $788,000, while excluding Auckland, median prices increased by 1.4% to $710,000 – highlighting continued strength across parts of the country.
While headline numbers appear steady, seasonally adjusted figures indicate a modest softening in underlying demand compared with February, consistent with a more cautious buyer environment.
Performance across the country continues to vary by region, reinforcing the uneven nature of the current market. Eleven of the sixteen regions recorded year-on-year increases in median prices, led by Southland (+11.8%), Nelson (+9.2%) and Northland (+8.7%), while Wellington and parts of the East Coast recorded softer results.
Time to sell remained steady in March, with properties taking a median of 41 days nationally – unchanged from a year ago but 15 days faster than February. Excluding Auckland, the median was also 41 days, down 14 days month-on-month, reflecting a return to more typical seasonal conditions rather than a shift in underlying demand.
Supply levels showed little change. New listings* increased just 0.2% year-on-year to 12,055, while excluding Auckland, there was no year-on-year change, with 5,513 new listings. National inventory levels* rose modestly by 2.1% from last year to 37,638 properties, reinforcing that there has been no significant lift in sellers entering the market despite recent global uncertainty.
Auctions continue to play a key role in some regions, particularly Auckland, Bay of Plenty and Canterbury. Nationally, 1,266 properties were sold at auction, accounting for 16.1% of all sales. In Auckland, nearly one in three properties (29.6%) were sold by auction, compared with 9.9% across the rest of the country.
The House Price Index (HPI), which provides a more accurate measure of underlying value trends, eased slightly over the month to 3,641 and remains 14.9% below its peak. However, regional performance continues to diverge. Otago reached a new record high HPI of 4,318, up 3.6% over the past year, while Canterbury sits just 0.03% below its peak – highlighting the strength of South Island markets, which have largely recovered from the 2022–23 downturn, while other parts of the country continue to rebuild more gradually.
“The Reserve Bank holding the OCR at 2.25% has provided a level of stability for the market, but there is still uncertainty ahead. While we haven’t yet seen a significant impact from global events in the data, agents across the country report that buyers became more cautious toward the end of March,” Lizzy Ryley said
“The focus now shifts to what happens next. Any early signs of a ceasefire have been overshadowed by renewed tensions, leaving uncertainty around fuel costs for New Zealand households and whether confidence begins to rebuild over the coming months,” Ryley says.
*Inventory and Listings data courtesy of realestate.co.nz
Notes:
Fact sheet
National Highlights for March
- The total number of properties sold in New Zealand decreased by 0.1% year-on-year, from 7,864 to 7,853 sales. New Zealand, excluding Auckland, declined by 0.6% year-on-year, from 5,404 to 5,370.
- Nationally, the seasonally adjusted figures for New Zealand show a sales count decrease of 4.1% compared to last month. Seasonally adjusted sales figures for New Zealand, excluding Auckland, show a 1.2% month-on-month decrease.
- Listings* nationwide increased by 0.2% year-on-year, reaching 12,055 new listings. For New Zealand, excluding Auckland, there was no year-on-year change, with 5,513 new listings.
- The median Days to Sell for New Zealand and New Zealand, excluding Auckland, had no change year-on-year at 41 days.
Regional Highlights for March
- Eleven of the
sixteen regions recorded year-on-year increases in median
prices; the highest increases were observed in:
o Southland, up 11.8% to $520,000
o Nelson, up 9.2% to $710,000
o Northland, up 8.7% to $750,000 - Ten
regions recorded an increase in sales compared to March
2025. The highest were in:
o West Coast, up 22.4% to 60 sales
o Bay of Plenty up 14.4% to 787 sales
o Southland, up 8.7% to 212 sales
More information on activity by region can be found in the regional commentaries on the REINZ's Website.
Median Prices
- Eleven of the sixteen regions recorded a year-on-year rise in the median price, with Southland showing the strongest growth at 11.8%.
- Across Auckland’s seven territorial authorities, five recorded an increase compared with March 2025, with Auckland City showing the largest lift at 4.9%.
- In Wellington, four of the eight territorial authorities saw an annual increase, led by Upper Hutt City at 13.0%.
- Central Otago District reached a new all-time territorial authority median price record this month: $885,000, beating the previous high of $880,000 recorded in November 2025.
Sales Counts
For all months
- Bay of Plenty, Canterbury and Southland had their highest sales counts since March 2021
- Auckland, Manawatu-Whanganui and Waikato had their highest sales count since November 2021
For the month of March
- Auckland, Bay of Plenty, Canterbury, Hawke's Bay, Manawatu-Whanganui, Nelson, Southland, Waikato and West Coast had their highest number of sales since 2021
Median Days to Sell
For the month of March
- Canterbury had its highest median Days to Sell since 2011
- Waikato had its highest median Days to Sell since 2013
- Nelson and Southland had their lowest median Days to Sell since 2021
House Price Index (HPI)
- Southland recorded the strongest HPI movement year-on-year, increasing 7.9%, ahead of Canterbury (3.7%) and Otago (both 3.6%).
- Over the three months to March, Southland showed the highest HPI growth nationwide at 3.7%, followed by Canterbury (2.2%) and Auckland and Taranaki (1.7%).
- Otago's HPI reached a new all-time high this month — the only region nationally to do so.
- New Zealand HPI year-on-year change is stable at 0.2%, an improvement from 0.0% recorded in February.
Inventory*
- Inventory increased year on year in nine of the fifteen included regions
- Auckland and Wellington have each experienced 26 consecutive months of year-on-year inventory growth.
- Auckland's March 2026 inventory figure is in the top 5% of all monthly inventory figures recorded since data began in 2007.
- West Coast recorded a year-on-year decrease in inventory figures (-1.0%), ending a 21 consecutive month streak of increases.
Listings*
- Inventory increased year-on-year in nine of the fifteen included regions
- Auckland and Wellington have each experienced 26 consecutive months of year-on-year inventory growth.
- Auckland's March 2026 inventory figure is in the top 5% of all monthly inventory figures recorded since data began in 2007.
- West Coast recorded a year-on-year decrease in inventory figures (-1.0%), ending a 21 consecutive month streak of increases.
Auctions
- In New Zealand, there were 1,266 auction sales (16.1% of all sales) in March 2026. For the same period last year, there were 1,208 auction sales (15.4% of all sales).
*Inventory and Listings data courtesy of realestate.co.nz
 UN Department of Global Communications: United Nations Proposes New Global Dashboard To Measure Progress Beyond GDP
 Banking Ombudsman Scheme: Fraud Check Delays Well Worth The Inconvenience, Says Banking Ombudsman
 Asia Pacific AML: NZ’s Financial Crime Gap - Beyond The 'Number 8 Wire' Mentality
 Westpac New Zealand: Kiwi Households Adapting Despite Widespread Cost Pressure Concerns, Westpac Survey Shows
 University of Auckland: Kids’ Screen Use Linked To Long-Term Deficits In Self-Control And Attention
 University of Auckland: Research To Address Equity In STEM For Māori, Pacific And Female Students