 Scoop has an Ethical Paywall


August Real Estate Market Sets Strong Platform For Spring
News Release 10 September
2012
August Real Estate Market Sets Strong Platform For Spring
Summary
• Sales
up over 16 per cent year on year
• Auckland
property market continues to strengthen
• House
prices up 2.5 per cent nationally since July
• REINZ Stratified House Price Index at all
time high nationally, and again in Auckland and
Christchurch
• New record level of auction sales
for the month of August
Signs of a modest revival in the housing market are being confirmed by a lift in sales and prices in August.
Data from the Real Estate Institute
of New Zealand (REINZ) shows there were 6,035 unconditional
sales in August, an increase of 843 sales (+16.2%) compared
with the same time last year and an increase of 2.2%
compared to July.
The national median house price
increased by $9,000 from $361,000 in July to $370,000 in
August, an increase of 2.5%. Auckland’s median house
price moved up 1.1 per cent, from the $500,000 level it has
stayed steady on for three months, to reach a new record
median price of $505,500. The national median house price
is up 4.2% compared to August last year.
Sales
volumes
All regions recorded increases in
sales volume compared to August last year, with Northland
recording an increase of just under 31%, followed by
Auckland with 25.6% and Taranaki with 22.2%. Seven regions
recorded increases in sales in August compared to July, with
Central Otago Lakes recording a 25.0% increase, Southland an
11.2% increase and Nelson/Marlborough an 8.9% increase.
Taranaki recorded a 14.0% fall in sales in August compared
to July, with Manawatu/Wanganui recording an 8.2% fall and
Wellington a 2.8% fall in sales.
Prices
For the month of
August, Nelson/Marlborough recorded the highest lift in
prices for the month with an increase of 9.6%, followed by
Taranaki with 7.3%, and Southland with 5.9%.
Compared to August 2011, Auckland recorded the highest lift in prices with an increase of 11.6%, followed by Canterbury/Westland with 6.2% and Wellington with 5.2%.
The REINZ Stratified House Price Index, which adjusts for some of the variations in mix that can impact on the median price, is 6.1% higher than August 2011 and is now at a new record high. The House Price Indices for Auckland and Christchurch also set new record highs in August.
“House buyers in Auckland are increasingly driving the New Zealand real estate market with a widening gap opening up between the dynamics of the Auckland market and the rest of the country. While both Auckland and Christchurch recorded new record median prices during the month it is the strong sales volume growth in Auckland that is most notable,” said REINZ Chief Executive Helen O’Sullivan. “Normally at this time of year we see a dip in sales volumes; this year, apart from the weather, winter was cancelled in Auckland. Across the rest of the country while we are continuing to see rising sales volumes, prices continue to reflect the general caution around the economic outlook. In many parts of the country we are also seeing shortages of houses available for sale, often a market feature at the end of winter, although expectations for a rush of listings in the spring are not strong.”
“This increased level of activity does need to be seen in context of an overall housing market that is still subdued and with prices yet to catch-up with increases in the consumer price index over the last five years.”
“A sure sign that housing market was back to normal levels of activity would be turnover reaching the pre 2008 long run average. This has yet to happen.”
Days to sell
The national
median ‘days to sell’ improved by three days in August
compared to July, from 38 to 35 days, with the number of
days to sell also improving by four days compared to August
2011. Over the past 10 years the median days to sell for
the month of August has averaged 36 days across New
Zealand.
Auckland recorded
the shortest days to sell at 30 days, followed by
Canterbury/Westland with 33 and Otago with 37 days.
Northland recorded the longest number of days to sell at 76
days, followed by Taranaki and Central Otago Lakes with 58
days.
Auctions
Nationally
there were 1,110 dwellings sold by auction in August
representing 18.4% of all sales, up from 588 sales in August
2011 representing 11.3% of all sales. This is a new
national record for the percentage of sale by auction and
beats the previous high of 16.2% reached in March 2012.
Auction sales in Auckland also reached a new record with
more than one in three sales in the region in August sold by
auction.
Transactions in Auckland again dominated the auction market, representing 73.3% of the national total of auction sales. Just over a third, 34.2%, of all dwelling sales in Auckland were by this method in August; this was up strongly from the 19.4% of sales by auction in August 2011. Sales by auction in Waikato/Bay Of Plenty accounted for 10.2% of the national total, Canterbury/Westland accounted for 7.7% of the national total, and all other regions combined accounted for the remaining 8.8% of auction sales in August 2012.
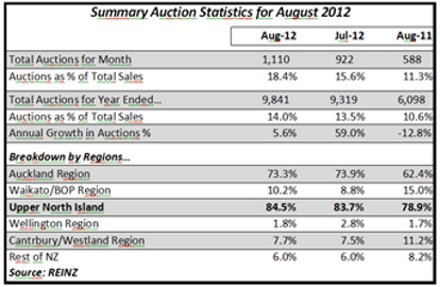
Click for big version.
Further Data
Across New Zealand the total value of residential sales, including sections was $2.79 billion in August, compared to $2.62 billion in July, and $2.18 billion in August 2011. For the 12 months ended August 2012 the total value of residential sales was $31.24 billion.
The breakdown of the value of properties sold in August 2012 is:
$1 million plus 252 4.2%
$600,000
to$999,999 912 15.1%
$400,000 to
$599,999 1,507 25.0%
Under
$400,000 3,364 55.7%
All Properties
Sold 6035 100.0%
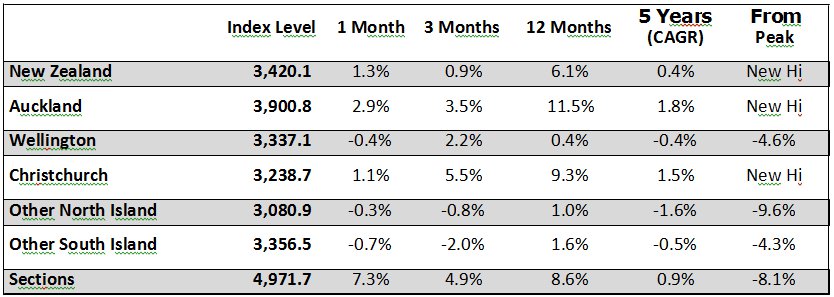
REINZ Stratified
Median Housing Price Index
The REINZ Housing
Price Index increased 1.3% in August compared with July to
sit at 3,420.1 to reach a new record high. The REINZ
Housing Price Index also once again recorded new record
highs in Auckland and Christchurch. By contrast,
Wellington’s measure remains 4.6% below its peak, set in
October 2009. Wellington, Other North Island and Other
South Island recorded falls in August. Compared to August
2011 the REINZ Housing Price Index rose 6.1%, Auckland rose
11.5% and Christchurch 9.3%.
Click for big version.
* CAGR is Compound Annual Growth
Rate
* The Christchurch data needs to be treated
with some caution due to compositional changes in the suburb
mix caused by the earthquakes in the
city
REINZ Stratified Median Housing Price
Index Chart
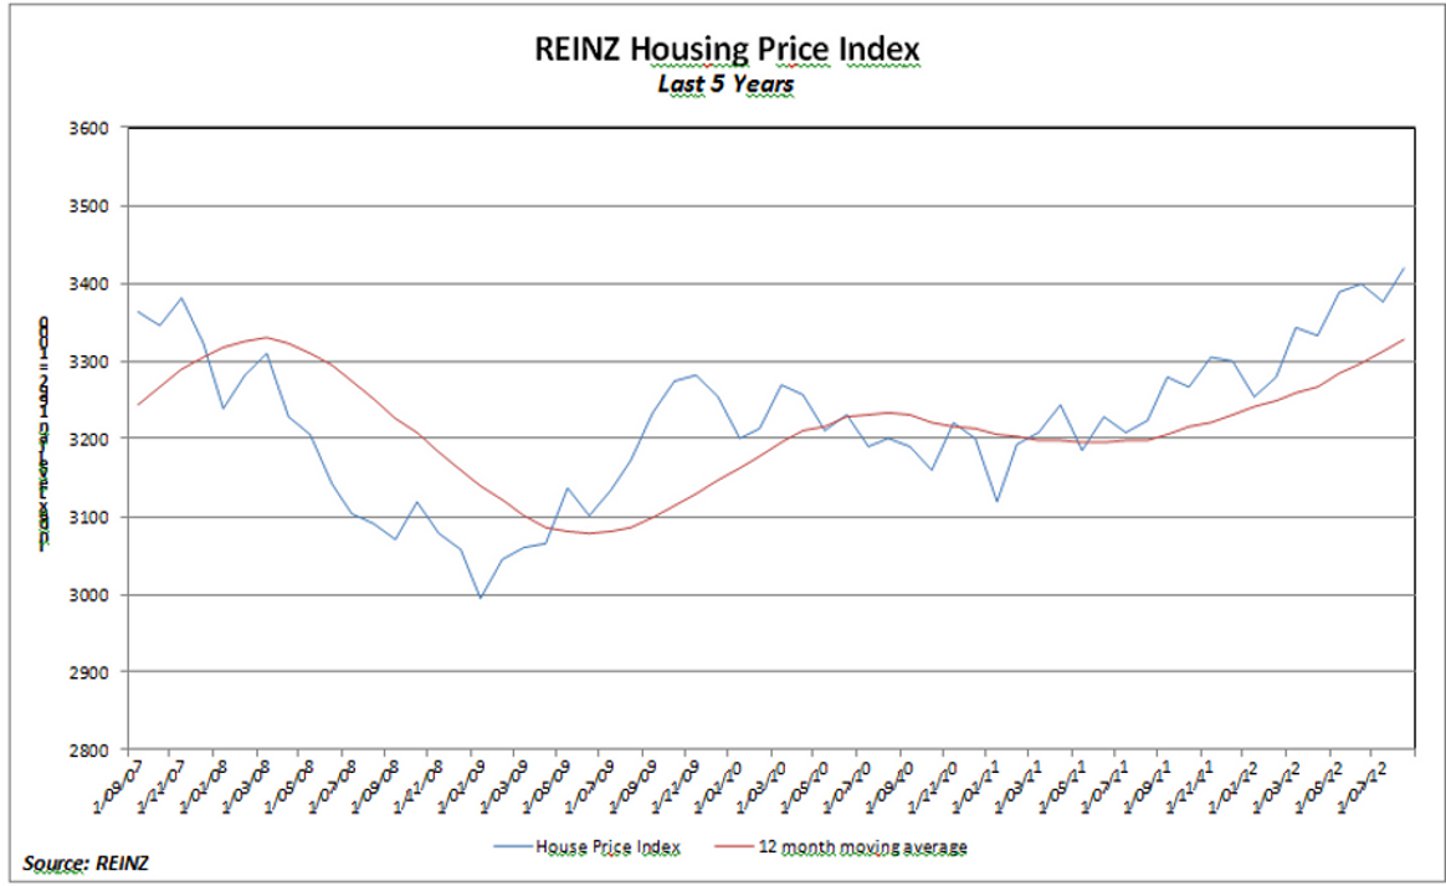
Click for big version.
REINZ_Residential_Market_Statistics__August_2012.pdf
ENDS
 University of Auckland: Junk Food Designed To Make Us Eat More, Study Finds
 Spark: New Report Sets Out Outcomes-Led Approach To Lift Rural Connectivity Using The Right Mix Of Technologies
 Bill Bennett: Fixed Voice Rules Head For Deregulation
 UN Department of Global Communications: United Nations Proposes New Global Dashboard To Measure Progress Beyond GDP
 Banking Ombudsman Scheme: Fraud Check Delays Well Worth The Inconvenience, Says Banking Ombudsman
 Asia Pacific AML: NZ’s Financial Crime Gap - Beyond The 'Number 8 Wire' Mentality