 Scoop has an Ethical Paywall


Market Update GoldCore 26 June 2013
Market Update GoldCore
Gold Tests Support At $1,200/oz – Possible 50% Retrenchment To $1,000/oz
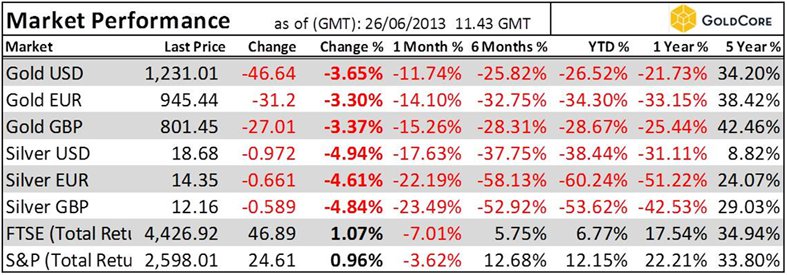
Today’s AM fix was USD 1,229.00, EUR
942.85 and GBP 799.97 per ounce.
Yesterday’s AM fix
was USD 1,285.00, EUR 979.42 and GBP 831.88 per
ounce.
Gold fell $5.00 or 0.39% yesterday and closed at
$1,277.30/oz. Silver finished off just 0.2%.
Gold was
pummelled overnight in Asia when a very large sell trade
just after the market opened led to further selling
throughout the session and this weakness continued in London
this morning.
Gold is now at its lowest level in 3 years. Somewhat positive U.S. economic data has again lifted stock markets and speculation that the Fed may decrease its QE over the next few months may be pressuring gold. However, these factors do not justify the scale of gold’s fall.
Click for big version.
The yellow metal has traded down for 7 out of 8 sessions since U.S. Fed Chairman Ben Bernanke claimed that he would ‘taper’ the bank’s $85 billion in monthly debt monetisation.
Gold looks set for one of its worst quarters on record after falling 7.6% in April, 6% in May and 11.5% in June.
The falls are out of all proportion to what is happening in the physical market in terms of supply and demand. They come despite strong fundamentals of continuing strong store of wealth demand and central bank demand globally.
Sentiment is as bad, if not worse, than it was during the 2008 sell off when gold bullion fell from $981 per ounce to $682 per ounce or 31%. Gold is now down 35% from its highs in August 2011 – a much longer time period.
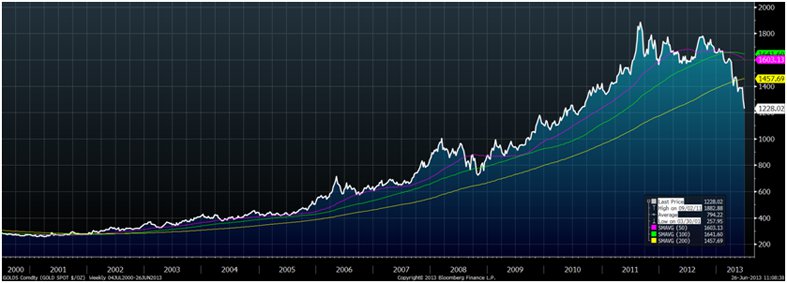
Click for big version.
Gold in USD, Weekly, 13 Year – (Bloomberg)
Gold is oversold on a host of different benchmarks from relative strength index (RSI) to moving averages. However, the old Wall Street adage to never catch a falling knife applies and buyers would be advised to dollar, pound and euro cost average into position.
Gold is now on sale at bargain prices and very cheap but in the short term it could get cheaper.
Gold is now set to test support at $1,200/oz. Momentum alone should see gold test support at $1,200/oz today or tomorrow. The question is whether support at $1,200/oz holds or whether we retrench even further and test support at the 2008 level of resistance which is $1,000/oz.
This would also mark a near 50% retrenchment from the August highs at $1,915/oz. A close below $1,200/oz this week would be bearish and could lead to further price falls.
News From Around The World
Some Hard Numbers On Western Banking System Sovereign Man
Gold's Sound Fundamentals and Bernanke's Taper Bluff Zero Hedge
Global Chaos Signals World Currency System Will Be Recast King World News
Download Comprehensive Guide To Investing In Gold
Everything you need to know about investing in gold. This complimentary ebook is a must have for anyone thinking of investing in gold.
In this ebook you will find out
about:
• Owning Gold
• The Investment Pyramid
• The Instruments of Gold Ownership
• How to
Buy Gold
• Dangers of Digital or e-Gold
• The
Difference Between Physical Gold and Paper Gold
ENDS
 Stats NZ: Economic Impacts On New Zealand From Conflict In The Middle East – Report
 Advertising Standards Authority: ASA Annual Report 2025 - Platform-Neutral Regulation Keeps Pace With Digital Advertising
 Science Media Centre: Lead Pipes Banned For New Plumbing – Expert Reaction
 New Zealand Young Physicists Trust: Auckland To Host The ‘World Cup Of Physics’ In 2027; Search Begins For Student-Designed Tournament Logo
 Oxfam Aotearoa: Top CEO Pay Increased 20 Times Faster Than Workers’ Pay In 2025
 Bill Bennett: TUANZ Report - Networks Built, Value Missing