 Scoop has an Ethical Paywall


ACI Asia-Pacific 5.7% increase in passenger traffic in May
ACI Asia-Pacific recorded 5.7% increase in passenger traffic in May 2013
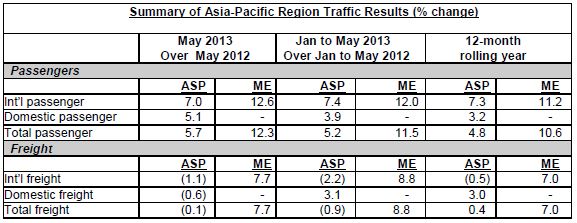
[July 11, 2013 – Hong Kong] Steady growth continued in the passenger traffic in the Asia-Pacific region for the month of May 2013, according to the latest ACI Passenger and Freight Flash Reports. A year-on-year increase of +5.7% and +12.3% were recorded at airports in Asia-Pacific and the Middle East respectively compared to May 2012.
Phuket (HKT) and Chiang Mai (CNX), both airports in Thailand, recorded the highest year-on-year percentage increase of 28% in the month of May 2013. Kuala Lumpur (KUL) follows with +22%.
The top 5 busiest airport in the region in May 2013 were Beijing (PEK), Tokyo Haneda (HND), Dubai (DXB), Jakarta (CGK) and Hong Kong (HKG).
Year-to-date increase was similar to last month. Increase of +5.2% and +11.5% was recorded in Asia-Pacific and the Middle East respectively comparing to same period, January to May last year.
Air cargo traffic registered a slight decrease of -1.0% in May 2013 at Asia-Pacific airports while Middle Eastern airports continued to grow steadily at +7.7% comparing to May 2012.
The top 5 airports with the highest cargo throughput in May 2013 were Hong Kong (HKG), Shanghai Pudong (PVG), Dubai (DXB),Seoul Incheon (ICN) and Beijing (PEK). Jakarta (CGK) was the airport with the highest percentage increase in cargo volume, recording +18.3% in May 2013, followed closely by Abu Dhabi (ABU) at +17.1%
The first five months of 2013 saw a small decline of -0.9% in cargo traffic for airports in Asia-Pacific and a strong +8.8% increase for airports in the Middle East.
Click for big version.
Note :
1. ASP = Asia-Pacific Area; ME = Middle East Area
2. ACI PaxFlash and FreightFlash statistics are based on a significant sample of airports that provide regular monthly reports to ACI. They represent approximately 60% of total passenger traffic and 70% of total freight traffic worldwide. Commentary, tables and charts are based on preliminary data submitted by participating airports and are therefore subject to change.
ENDS
 University of Auckland: Kids’ Screen Use Linked To Long-Term Deficits In Self-Control And Attention
 University of Auckland: Research To Address Equity In STEM For Māori, Pacific And Female Students
 Stats NZ: Economic Impacts On New Zealand From Conflict In The Middle East – Report
 Advertising Standards Authority: ASA Annual Report 2025 - Platform-Neutral Regulation Keeps Pace With Digital Advertising
 Science Media Centre: Lead Pipes Banned For New Plumbing – Expert Reaction
 New Zealand Young Physicists Trust: Auckland To Host The ‘World Cup Of Physics’ In 2027; Search Begins For Student-Designed Tournament Logo