 Scoop has an Ethical Paywall


Housing market volumes & prices jump to reassert March norms
NEWS RELEASE 13 April 2017
Housing market volumes and prices jump to reassert March norms
…as the new REINZ HPI indicates high value sales are lifting median prices
This month the Real Estate Institute are pleased to launch the REINZ House Price Index (HPI). Developed in partnership with the Reserve Bank of New Zealand, the REINZ HPI provides a level of detail and understanding of housing activity over time to a higher standard than anything else available in New Zealand. REINZ HPI is the most accurate, timely and stable HPI in New Zealand and is at a world class standard.
Following a mixed outlook for the New Zealand housing market in February, March has shown traditional lifts in terms of median price, volume and activity levels, according to the latest figures released today by REINZ, source of the most complete and accurate real estate data in New Zealand.
The market reached its peak level of activity for the year so far as median house prices firmed and sales volumes rose strongly across New Zealand during March, which is traditionally the busiest month for real estate transactions across New Zealand.
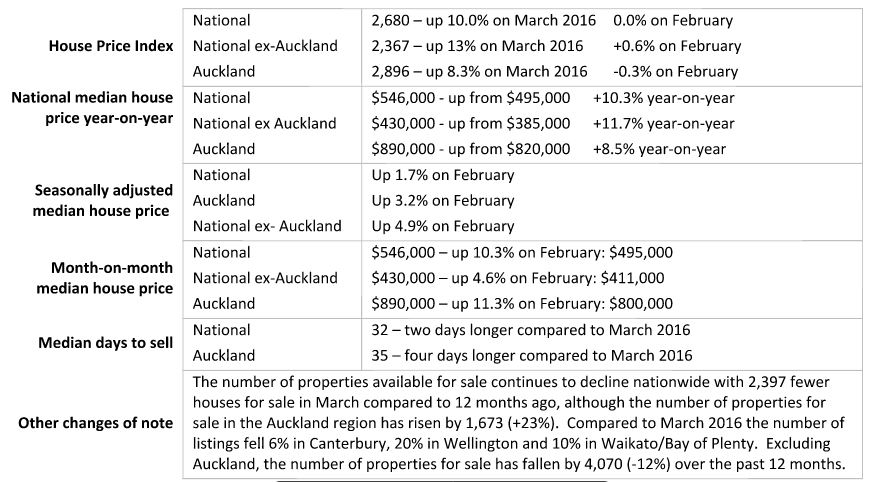
The national median price rose $51,000 to $546,000 during March, an increase of 10% on February and a new record median, while eight of 12 regions hit new record high median sale prices: Auckland, Northland, Waikato/Bay of Plenty, Hawke’s Bay, Manawatu, Taranaki, Canterbury/Westland and Otago. On a seasonally adjusted basis the national median rose 2%.
The number of sales for March 2017 was 8,504, an increase of 36% on February, although down 11% compared to March 2016. On a seasonally adjusted basis sales for March rose 2% compared to February, indicating an expected seasonal effect.
KEY DATA SUMMARY:
Real Estate Institute of New Zealand (REINZ) CEO Bindi Norwell says: “March reflects the seasonal peak for the year so far, with the largest number of homes sold and the largest month-on-month increase in the median price, as we normally expect to see this month.
“Auckland has recorded another record median price and a 66% jump in sales volumes on February, but it should be noted that the ‘March effect’ is more pronounced in Auckland than in other regions. Further, the level of inventory in Auckland are rising quickly with 47% increase in inventory over the past month, offering buyers more choice.”
New REINZ HPI shows March median price changes driven by higher priced sales
REINZ has also released a new House Price Index today, developed in partnership with the Reserve Bank of New Zealand.
Already being used by the Reserve Bank’s forecasting and macro financial teams, plus the major banks, the REINZ HPI provides a new level of detail and understanding of the true movements of housing values over time. It does this by analysing how prices in a market are influenced by a range of attributes such as land area, floor area, number of bedrooms etc. to create a single, more accurate measure of housing activity and trends over time. Using the Reserve Bank’s preferred Sale Price to Appraisal Ratio (SPAR) methodology, the REINZ HPI uses unconditional sales data (when the price is agreed) rather than at settlement, which can often be weeks later. It is therefore more accurate and timely.
Describing the new REINZ HPI as ‘the gold standard’ in New Zealand house price analysis tools, REINZ CEO Bindi Norwell says: “The REINZ HPI takes many aspects of market composition into account, and thus provides more accurate results. When applied to the March data, the HPI indicates that the lift in the median price was largely driven by changes in the underlying mix of dwellings sold in March compared to February. While the median price went up $51,000 across New Zealand, the HPI was stable month-on-month, at 0.0% change, indicating more sales in higher price brackets than lower ones.
“Furthermore, the HPI numbers are backed by anecdotal evidence from around the country saying that investors and first home buyers are facing more challenges in securing bank lending compared to this time last year, which is lowering the number of dwellings sold in the lower price bracket. As a result, there are comparatively more sales in higher price brackets, which is lifting the median price. Although this gives the overall impression of rising prices, the underlying data shows that the median is moving more due to differences in the mix of dwellings being sold each month.”
Year-on-year, the HPI indicates that activity nationwide has lifted 10%, up in Auckland by 8.3% and outside Auckland by 13%.
Sales volumes
There were 8,504 unconditional residential sales in March, representing a 36% increase on February, although an 11% decline on March 2016. On a seasonally adjusted basis, the number of sales rose 2% from February to March, indicating that the lift in sales was largely a seasonal effect, with March traditionally the busiest month of the year.
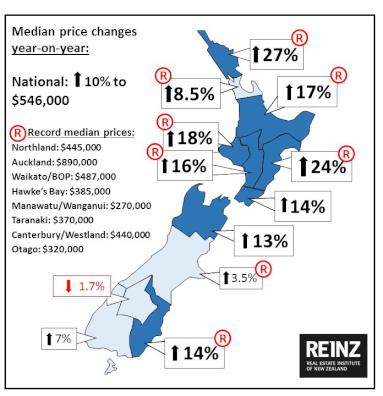
Median prices
The national median house price rose $51,000 (+10%) year-on-year. Compared to February the national median house price also rose $51,000 (+10%). Northland recorded the largest percentage increase in median price compared to March 2016, at 27%, followed by Hawke’s Bay at 24% and Taranaki at 18%. Eight new regional median price records are shown in the map (see right).
Auction sales
There were 1,637 dwellings sold by auction nationally in March, representing 19% of all sales and a decrease of 717 (-30%) on the number of auctions in March 2016.
Auctions in Auckland represented 59% of national auction sales, with the number of auctions in Waikato/Bay of Plenty representing 16% of national auction sales and the number of auctions in Canterbury/Westland representing 13% of national auction sales. These three regions represented 88% of auction sales in March 2017.
Days to sell
The number of days to sell decreased by seven days to 32 days from February, but increased two days compared to March 2016. March traditionally sees a large drop in the number of days to sell compared to February. Otago had the fewest number of days to sell at 20 days followed by Wellington at 25 days and Nelson/Marlborough at 28 days. Northland and Central Otago Lakes had the most number of days to sell at 37 days, while in Auckland the number of days to sell fell by eight days to 35 days compared to February (43) although up by four days compared to March 2016.
Million dollar homes show largest increase in volumes
Between March 2016 and March 2017, the number of homes sold for more than $1 million rose by 5% to 1,360 homes to equal 16% of all dwellings sold, a new record for both the number and percentage of homes sold. The number of dwellings sold under $600,000 has declined by 1,127 between March 2016 and March 2017 compared to a fall of 1,023 for all dwellings.
For regional commentary and tables, please see the accompanying report.
REINZ_Monthly_Property_Report__March_data_2017.pdf
- ENDS -
Note to Editors:
The monthly REINZ residential sales reports remain the most recent, complete and accurate statistics on house prices and sales in New Zealand. They are based on actual sales reported by real estate agents. These sales are taken as of the date that a transaction becomes unconditional, up to 5:00pm on the last business day of the month. Other surveys of the residential property market are based on information from Territorial Authorities regarding settlement and the receipt of documents by the relevant Territorial Authority from a solicitor. As such, this information involves a lag of four to six weeks before the sale is recorded.
*Seasonal adjustment is a statistical technique that attempts to measure and remove the influences of predictable seasonal patterns to reveal how the market changes over time.
 Bill Bennett: Fixed Voice Rules Head For Deregulation
 UN Department of Global Communications: United Nations Proposes New Global Dashboard To Measure Progress Beyond GDP
 Banking Ombudsman Scheme: Fraud Check Delays Well Worth The Inconvenience, Says Banking Ombudsman
 Asia Pacific AML: NZ’s Financial Crime Gap - Beyond The 'Number 8 Wire' Mentality
 Westpac New Zealand: Kiwi Households Adapting Despite Widespread Cost Pressure Concerns, Westpac Survey Shows
 University of Auckland: Kids’ Screen Use Linked To Long-Term Deficits In Self-Control And Attention