 Scoop has an Ethical Paywall


Kiwis Spent More On Food But Less On Other Consumer Products And Services In July
AUCKLAND, 6 August 2025 – Consumer spending increased again in July 2025, although data released by Worldline NZ point to higher prices as a large influence.
Figures released today show consumer spending recorded through all Core Retail merchants in Worldline NZ’s payments network in July 2025 reached $3.72B, which is up +2.4% on July 2024, following adjustments for merchants coming and going from the network.
Worldline NZ’s Chief Sales Officer, Bruce Proffit says July 2025 marks the fourth month in a row that Worldline has recorded consumer spending at levels above those of a year ago.
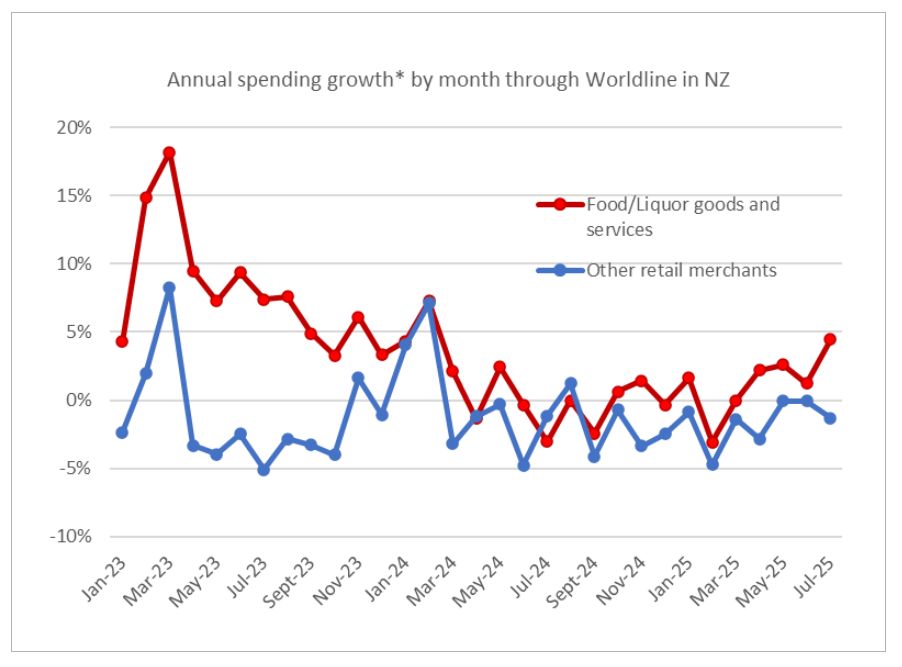
“Higher spending is generally welcomed by consumers and merchants alike. However, the caveat on the current pattern is that the growth is largely amongst merchants selling food, including the likes of grocery stores, takeaway outlets and cafes,” says Proffit.
“This correlates with recent price rises seen on many food products, which suggests this is the most likely factor driving the overall lift in spending.
“In previous months there was a lift in spending seen amongst other merchant sectors, insomuch as the annual decline in spending had halted in May and June. This was not the case in July, although the annual decline was modest.”
Looking at regional spending across the combined Core Retail sector shows annual spending growth for July was highest in South Canterbury (+6.0%), Waikato (+5.8%) and Whanganui (+5.8%), while spending declined on July last year in Marlborough (-2.8%).
Meanwhile, spending growth in the three largest regions – Auckland/Northland, Wellington and Canterbury – remain amongst the weakest nationally at +1.6%, +2.2% and +3.4% respectively.
| WORLDLINE All Cards underlying* spending for CORE RETAIL merchants for July 2025 | ||
| Value | Underlying value* | |
| Region | transactions $millions | Annual % change on 2024 |
| Auckland/Northland | 1,378 | 1.6% |
| Waikato | 311 | 5.8% |
| BOP | 251 | 1.2% |
| Gisborne | 34 | 2.0% |
| Taranaki | 89 | 4.4% |
| Hawke's Bay | 131 | 4.4% |
| Whanganui | 53 | 5.8% |
| Palmerston North | 117 | 4.4% |
| Wairarapa | 43 | 5.1% |
| Wellington | 323 | 2.2% |
| Nelson | 73 | 5.2% |
| Marlborough | 46 | -2.8% |
| West Coast | 26 | 3.6% |
| Canterbury | 450 | 3.4% |
| South Canterbury | 61 | 6.0% |
| Otago | 239 | 4.2% |
| Southland | 88 | 1.1% |
| New Zealand | 3,717 | 2.9% |
Figure 2: All Cards NZ underlying* spending through Worldline in July 2025 for core retail merchants (* Underlying excludes large clients moving to or from Worldline)
Note:
These figures reflect general market trends and should not be taken as a proxy for Worldline‘s market share or company earnings. The figures primarily reflect transactions undertaken within stores but also include some ecommerce transactions. The figures exclude transactions through Worldline undertaken by merchants outside the Core Retail sector (as defined by Statistics NZ).
 Bill Bennett: Fixed Voice Rules Head For Deregulation
 UN Department of Global Communications: United Nations Proposes New Global Dashboard To Measure Progress Beyond GDP
 Banking Ombudsman Scheme: Fraud Check Delays Well Worth The Inconvenience, Says Banking Ombudsman
 Asia Pacific AML: NZ’s Financial Crime Gap - Beyond The 'Number 8 Wire' Mentality
 Westpac New Zealand: Kiwi Households Adapting Despite Widespread Cost Pressure Concerns, Westpac Survey Shows
 University of Auckland: Kids’ Screen Use Linked To Long-Term Deficits In Self-Control And Attention