 Scoop has an Ethical Paywall


Property Pulse: Bend In The Road
- House prices expected to finish 2025 broadly flat on last year, the third straight sideways year
- Trend expected to bend upwards next year; we continue to build in a 4% annual gain.
- The risk profile around this view is wide, but we think a downside skew prevails
- Mortgage rate downtrend almost done
Welcome to our final Property Pulse for 2025. Supporting our more regular Eco Pulse updates, we chat through recent housing and mortgage rate happenings, and provide our take on the outlook.
The view, in brief
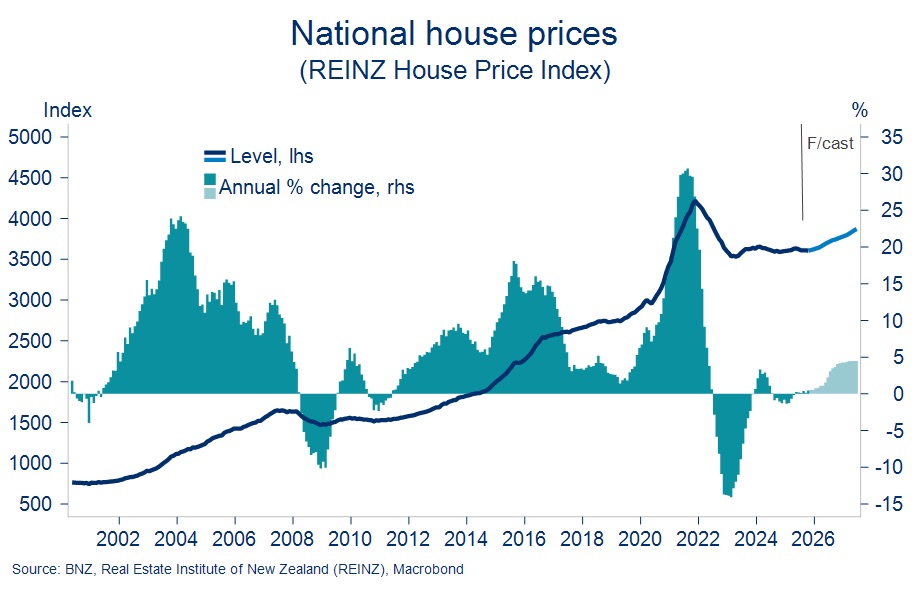
The NZ housing market spent most of this year in a broad state of balance. Ample supply absorbed an increase in demand and national house prices consequently shuffled sideways. We think they’ll end 2025 up 0.5% y/y.
Next year the economy is expected to defrost, mortgage rates stay low, and population growth lift a bit. In theory, that’s enough demand stimulus to see house prices push up and out of their three-year stasis. But the interaction with a still healthy-looking pipeline of supply remains a key uncertainty. It adds a whiff of downside risk to our forecast for a 4% lift in house prices next year.
The end of the Reserve Bank’s easing cycle is in sight. Our view is that a 25bps OCR cut later this week is likely to be the last, marking 2.25% as the cycle low. That leaves only a little further for mortgage rates to fall. We work through some mortgage fixing considerations below.
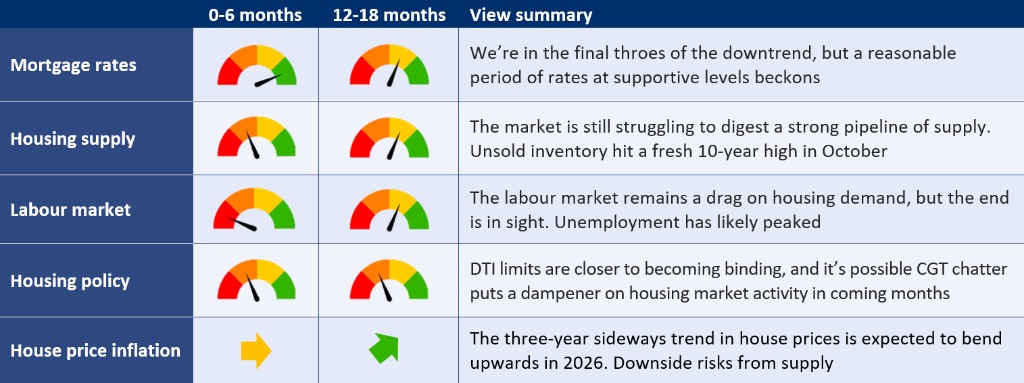
Impact of macro drivers on our house price view
The table below summarises the various drivers of house price inflation and their directional impact on our view.
Housing market in balance, prices drift sideways
The past few months’ worth of housing data – including last week’s REINZ figures for October – has done little to disturb our thesis the national market remains in a broad state of balance.
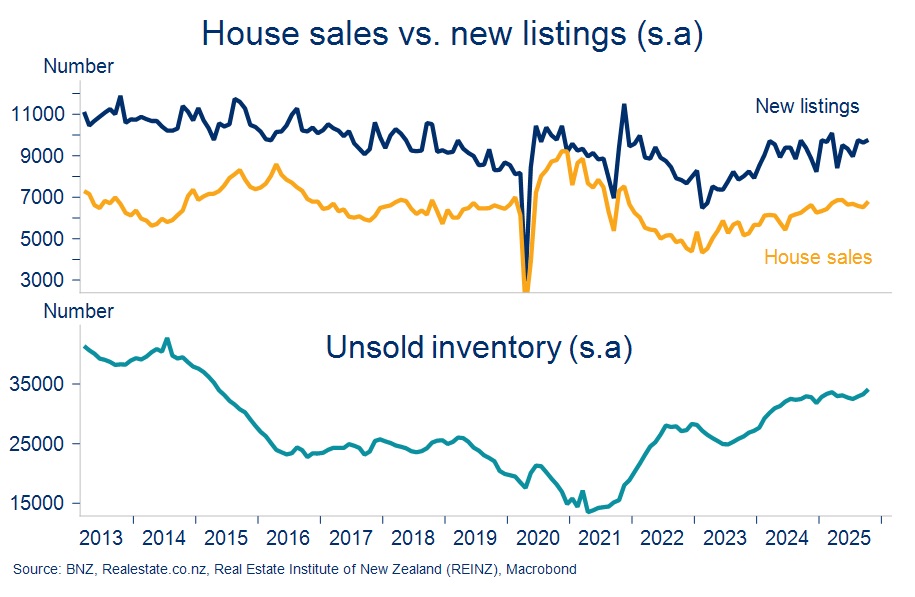
Monthly house sales are now running about 5% ahead of this time last year, thanks to a decent bounce-back in October (all data seasonally adjusted). They continue to wobble around the long-run average of roughly 6700 sales per month (s.a).
But even as lower interest rates have elicited this extra housing demand, supply has kept pace. New listings growth has just kept its nose in front of sales growth such that unsold inventory has continued to rise. In fact, it hit fresh 10-year highs in October. That continues to nullify any pressure on house prices to rise and is in contrast to expectations the inventory overhang would be worked off this year.
National house prices were again flat in October (REINZ House Price Index). They’re also flat on last year (technically +0.4%y/y) and flat on levels of almost three years ago. In inflation adjusted terms, house prices are back to 2019 levels.
Our (unchanged) expectation is that this trend broadly continues in the short-term, with national house prices slated to finish the year up 0.5%. That’s premised on very small monthly (seasonally-adjusted) gains over November and December.
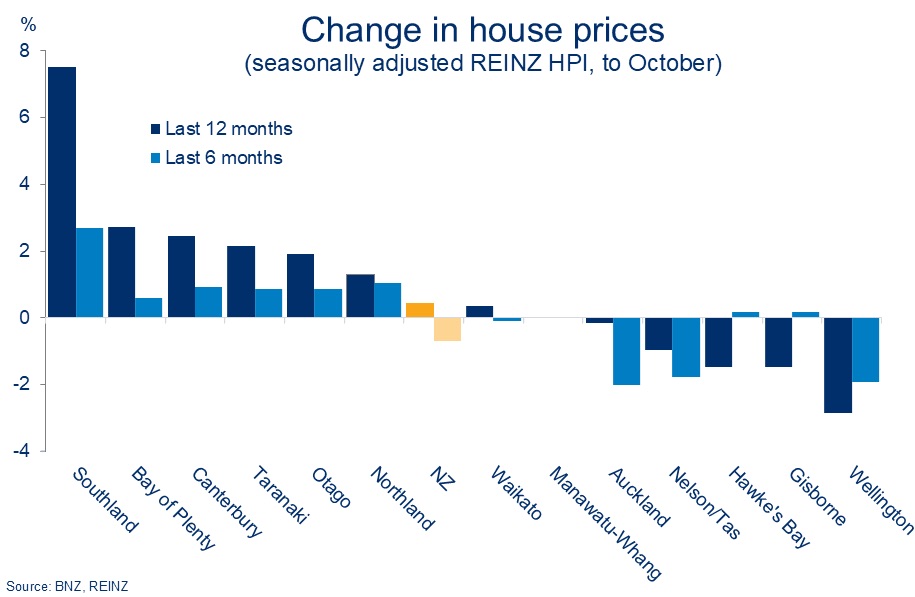
That’s the topline picture, but we’re once again quick to highlight the divergent trends hiding beneath the surface. Our research from earlier in the year flagged the townhouse market and the regions of Auckland and Wellington as likely candidates to go their own way thanks to a relative abundance of supply in those areas. And so it has largely proved.
Auckland, Wellington, and the Top of the South remain clear underperformers – particularly over the last six months (chart below). That’s set against the relative strength of Southland (+7.5%y/y!), Canterbury, and the Bay of Plenty.
Since our last update, the Labour Party has announced it will campaign on a capital gains tax (CGT) as part of its 2026 election campaign. We’ll park the possible impacts the proposed July 2027 implementation of such a policy might have. They are, after all, distant and uncertain.
There is the risk though that CGT chatter has a more immediate impact in restraining housing market activity, particularly amongst investors. There’s been some evidence of this in previous periods where a CGT was floated and debated. For example, through 2014 in the run-in to the September election and in 2018/2019 following the recommendations of the Tax Working Group.
Given all else that’s going on, it’s always difficult to disentangle the specific impacts of housing policy. For example, through most of 2014 mortgage rates were rising which would have also been weighing on the housing market alongside policy uncertainty. But it seems reasonable to assume there will be some activity suppressing impacts from CGT and other policy uncertainty as we move through 2026.
Stacking up the fundamentals for 2026
Below, we take a look at how some of the other key housing fundamentals like interest rates, population growth, supply, and the labour market are likely to fare next year.
To summarise upfront, the economy’s expected to defrost, mortgage rates stay low, and population growth lift a bit. In theory that’s enough demand stimulus to see house prices push up and out of their three-year stasis.
We’ll get to the supply side in a sec, but just to cover off these demand drivers in a little more detail:
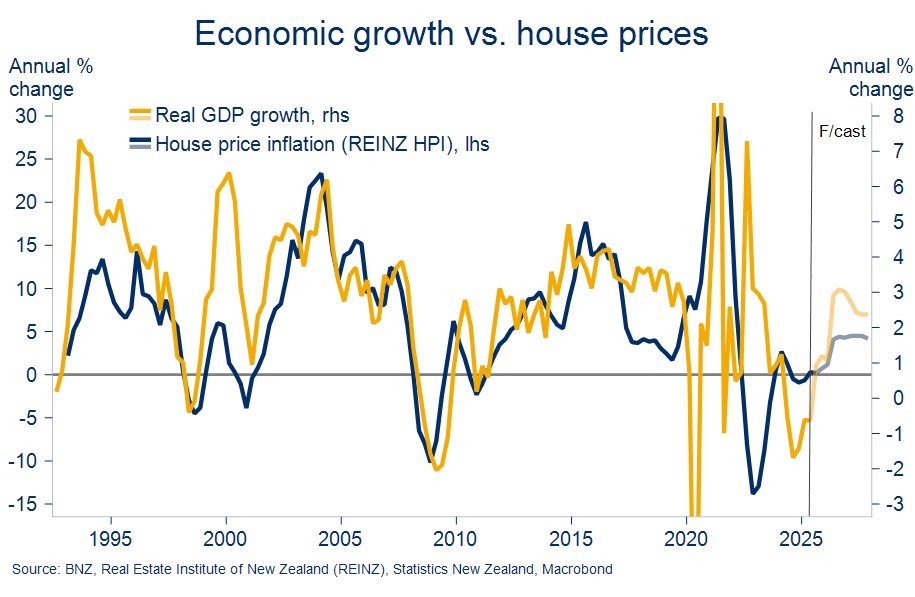
1. We’re increasingly confident the economy is starting to right itself and that growth momentum will build through next year. Firming GDP growth of course doesn’t directly cause house prices to rise but a cyclical upswing does usually bring with it better labour market conditions, more population growth, and happier consumers – all things that do tend to matter for housing demand. Higher house prices also feed back into economic activity via the wealth effect and price signals to the construction sector. Hence the strong trend historical relationship between house price inflation and the growth cycle, as below.
2. Mortgage rates are now 200-300bps below the late-2023 highs. Our forecasts (see mortgage rate section) have the downtrend winding up in the first half of next year. Nonetheless, many fixed rates are expected to remain sub-5% for a significant portion of the year.
Lower mortgage rates not only reduce the servicing costs of a mortgage but also boost prospective buyers’ borrowing capacity as bank test rates come down. With national house prices still 14% below the 2021 highs, the improved affordability calculus has been particularly conducive to first home buyer demand. But as the average mortgage rate paid on the stock of mortgage debt continues to come down we should see a little more demand from owner-occupiers next year (60% of new lending flows).
3. Population growth is hovering around half the long-run average at an annual rate of 0.6% (year to September). That’s well back on last year’s 1.2%. The deflation of the population boom may well have taken a bigger toll on house prices this year were it not for the offset from lower mortgage rates. Annual rental price inflation of -2.0% (year to September, new tenancy rents) is suggestive of such.
Our forecasts suggest we’re rounding the low point in the population growth cycle around now. Some firming is slated for next year as improving economic and labour market conditions attract increased numbers of new migrants and slow the pace of resident departures.
What about the supply side?
A solidifying demand picture is all well and good but, as we’ve seen this year, it doesn’t necessarily translate into higher house prices in an environment of ample supply.
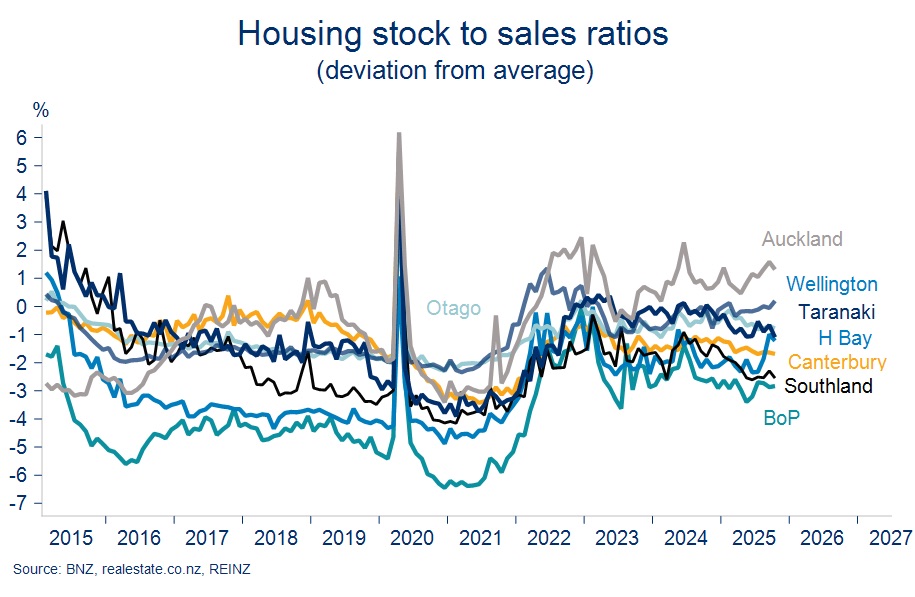
Regional relativities provide a useful case study. At a high level, the bigger the supply response, the less upward pressure we’ve seen on regions’ prices this year. It’s a dynamic we’ve regularly flagged, and Auckland and Wellington still come out on top of various metrics capturing changes in supply relative to demand. For example, we plot stock-to-sales ratios below.
South Island regions and the Bay of Plenty generally occupy the relatively tighter end, in rankings that broadly mirror the price appreciation chart on the first page.
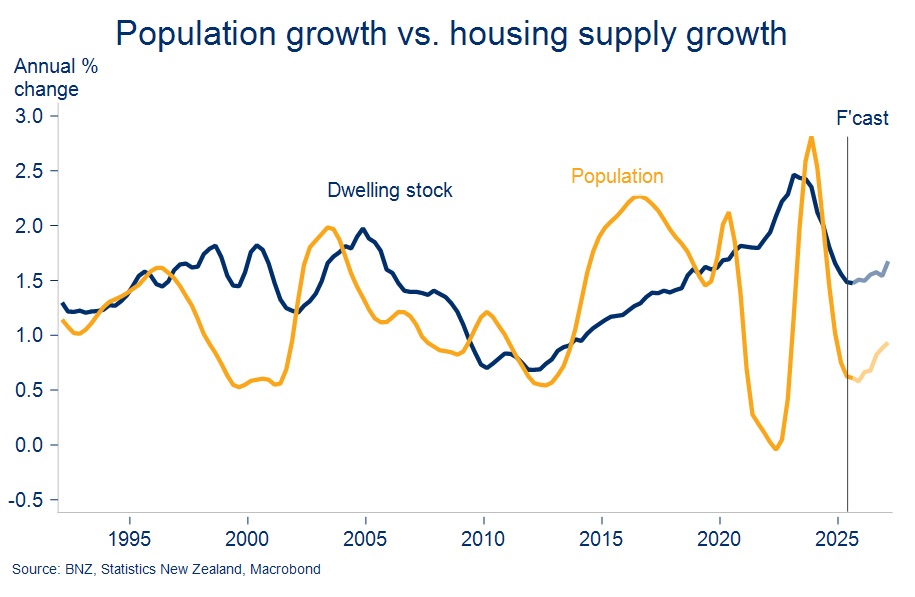
Looking to next year, we’re cognisant that the residential construction cycle seems to be turning at a time when population growth is yet to do so. That’s not necessarily a surprise - we’ve been highlighting in our forecasts the fact population growth is likely to remain below that of growth in the dwelling stock (chart below, note here).
It’s something that could keep the pipeline of supply relatively healthy as we move into next year, absorbing any extra housing demand we do see.
The government has also made no secret of its intent to boost housing supply (changes to consenting process, density/zoning changes, infrastructure reform, efforts to boost Greenfields development etc). It’s very hard to estimate the timing of if/when all of this might come to fruition, but it does play to the grain of a more responsive supply side and a reduced impact on house prices for any given shift in housing demand next year.
These considerations leave us comfortable building in a below-average lift of 4% in national house prices for calendar 2026. As always, there are huge risks either side of this forecast, but we’d see the balance as tilted slightly more to the downside.
Mortgage rate outlook
Our view at a glance (all based on our forecasts for the Official Cash Rate and wholesale interest rates)
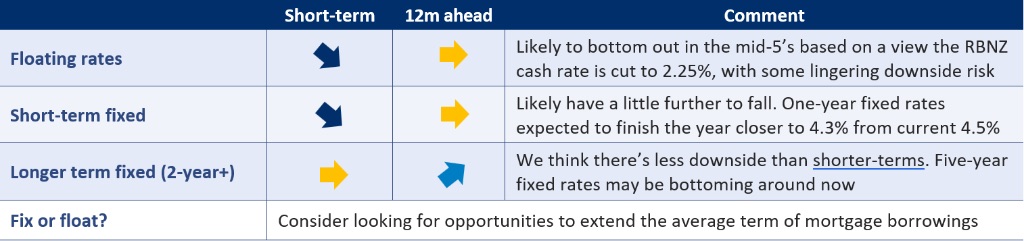
Floating rates – home stretch
The end of the Reserve Bank’s easing cycle is in sight. Yes, there’s still debate about exactly how low the Official Cash Rate (OCR) will go. Our view is that a 25bps cut later this week would likely be the last, marking 2.25% as the cycle low. The risk of one further cut (taking the OCR to 2.00%) can’t be ruled out though, should recent signs of life in the economy fail to take root.
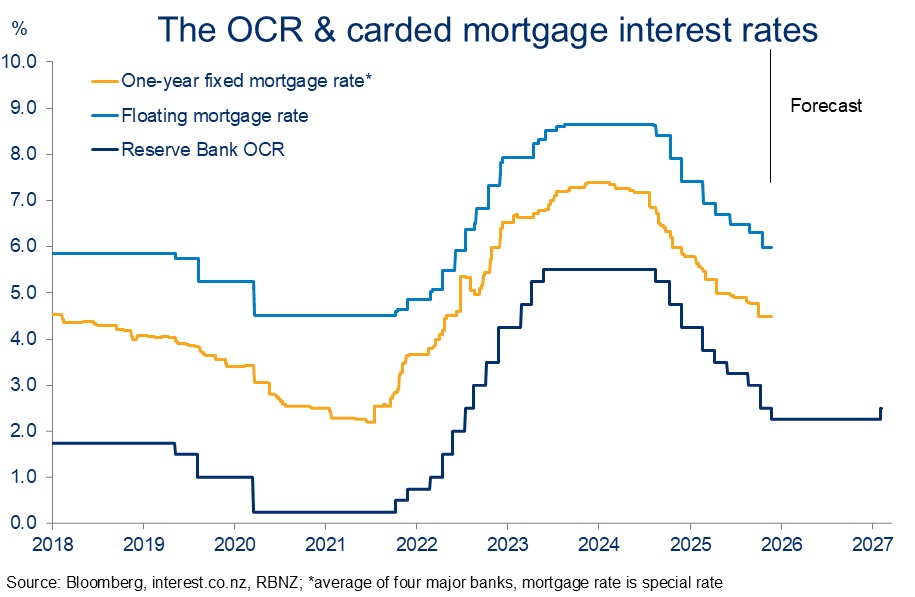
Either way, the downtrend in retail interest rates appears to be nearing the finish line. It may not be long before the debate shifts from ‘how low?’ to ‘how long?’ The Reserve Bank’s forecasts and body language at this week’s meeting will be important given the lengthy delay until the next (late February) one.
For the moment, our outlook for the cash rate is consistent with (carded) floating mortgage rates winding up a little lower than current rates around 6.00%.
Fixed rates – downtrend approaches the end
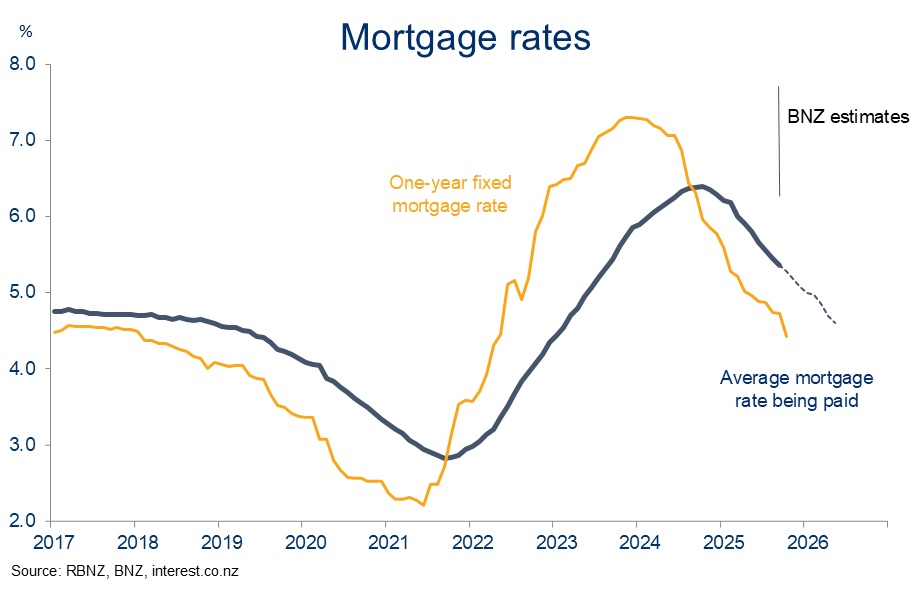
Fixed mortgage rates have fallen a bit faster than expected in recent months, largely thanks to the Reserve Bank’s front-loaded approach to easing. Since August, there’s been a near parallel shift down in the mortgage curve to the tune of 25-40bps (chart below).
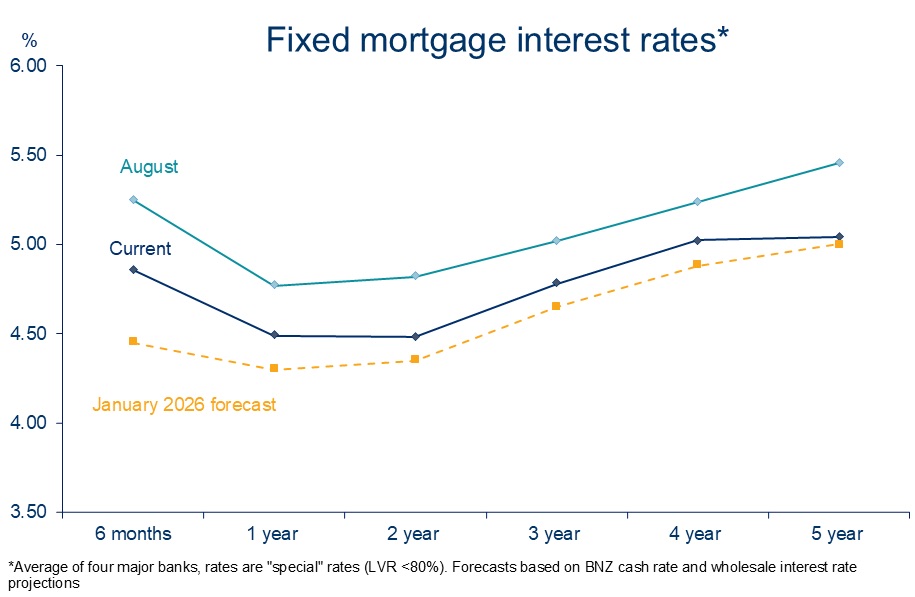
‘Front-loading’ interest rate cuts of course suggests less to do later. So we don’t expect fixed mortgage rates to keeping falling at the same pace they have been. Added to our caution here is the fact current market pricing already has one and a half more 25bps OCR cuts baked into it.
Still, the downdraft of the OCR approaching its cycle low, coupled with our expectation the Reserve Bank will retain some downside ‘optionality’, is expected to deliver a few final downward tweaks. Declines are expected to be concentrated more at the short-term of the curve. Longer-term rates like the five-year may be in the process of bottoming out around now.
What have borrowers been doing?
Just when it looked like mortgage borrowers were starting to dip their toes into longer-term fixes, there was some back-peddling into short terms over August and September (the latter being the latest month we have system-wide data for).
That proved prescient in light of the economy’s mid-year wobbles and the Reserve Bank’s subsequent dovish pivot and 50bps October rate cut.
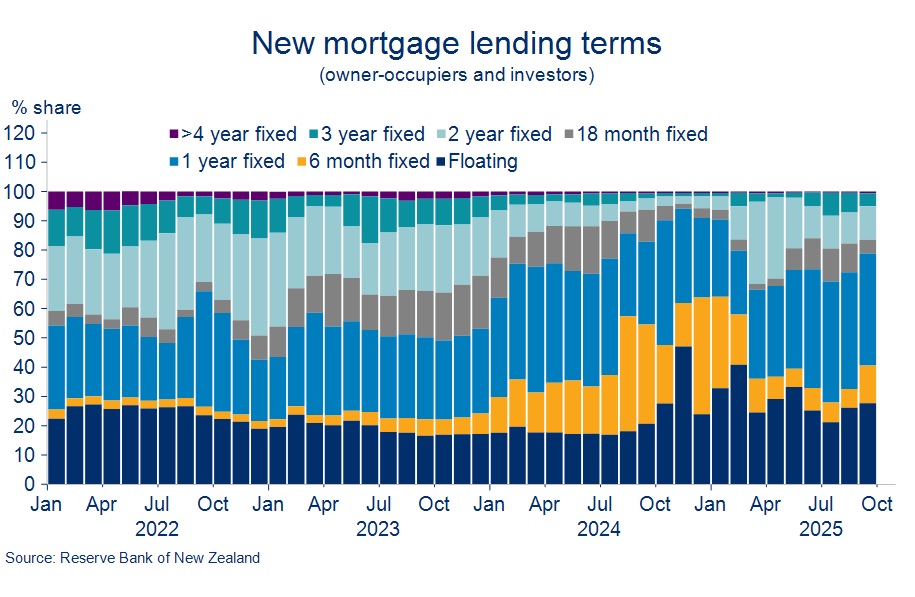
With the RBNZ on track to cut again this week, we can reasonably expect the preference to stay short remained strong in October and November. In aggregate, borrowers continue to read the tea leaves of this interest rate cycle well.
Mortgage strategy
Before diving into the rate fixing debate, it’s worth reiterating that getting a mortgage strategy “right” is primarily about meeting a borrower’s financial needs and requirements for certainty. Trying to pick the timing of interest rate movements is fraught with difficulty.
If we’re indeed into the closing stages of the rate cutting cycle, the fixing decision for a new or refixing borrower today could be framed as:
a) start terming out
mortgage borrowings now – acknowledging you might not pay
the absolute cycle low – to hedge the risk mortgage rates
start rising again sometime next year; or
b) stick to
floating and short terms a little longer on the expectation
there’s no rush and there’s a little more juice to be
squeezed out of the downtrend.
Both options offer some embedded ‘insurance’ against scenarios that differ from the economic consensus. Option a) hedges you against the risk inflation proves more troublesome next year than the Reserve Bank expects and some early reversal of this year’s rate cuts is required.
Conversely, option b) would allow the borrower to participate in continued interest rate declines should something ‘go wrong’ with the economic recovery and the RBNZ is forced to cut deeper than anyone currently expects. An assessment as to which of these is more likely and/or troublesome may help shade the fixing decision one way or the other.
As always, breakeven analysis can help put a bit of structure around the decision. Start with a comparison of a six-month fix vs. an 18-month one. You can currently fix for 18 months at around 4.45%, or six months at about 4.85%. The latter strategy entails a higher rate upfront but offers the potential to refix at a lower rate in six months’ time should mortgage rates have fallen over that period.
Our view implies that they will, but whether the falls will be enough to break-even might be borderline. A strategy in which a six-month fixed term was later rolled into a one-year term would require the one-year rate in six months’ time to be 4.25% or lower in order to break-even relative to fixing for 18 months now. That’s certainly conceivable, but it’s still a long way to fall from current levels.
Moving on to look at longer terms, one and two-year fixed terms are priced at similar rates around 4.5%, with three years a little higher close to 4.80%. Two-years might appeal relative to one given you’re hedged an extra year for no additional up-front cost. But what about three years?
Say you’re weighing up fixing for three years now, or fixing for one year and then rolling into a two-year fix when it matures. The latter scenario requires the two-year rate in a year’s time to be 4.95% or lower to breakeven. That has us thinking a three-year fix might not be a bad option, particularly if three-year rates nudge a little lower in coming months.
Overall, we’re left with a view there’s now more merit in looking to extend the term of mortgage borrowings. The Reserve Bank’s easing bias might suggest there is no rush, but signs of life in the economy and the nearing end of the OCR easing cycle do argue for at least making a plan. For many, spreading risk over a range of borrowing terms (say one, two, and three-year) might be a prudent way of covering off the various risks in play.
 Bill Bennett: Fixed Voice Rules Head For Deregulation
 UN Department of Global Communications: United Nations Proposes New Global Dashboard To Measure Progress Beyond GDP
 Banking Ombudsman Scheme: Fraud Check Delays Well Worth The Inconvenience, Says Banking Ombudsman
 Asia Pacific AML: NZ’s Financial Crime Gap - Beyond The 'Number 8 Wire' Mentality
 Westpac New Zealand: Kiwi Households Adapting Despite Widespread Cost Pressure Concerns, Westpac Survey Shows
 University of Auckland: Kids’ Screen Use Linked To Long-Term Deficits In Self-Control And Attention