 Scoop has an Ethical Paywall


Looking At The Past To See The Future
- There’s never a quiet end to the year in our world. We’ve had plenty going on, and this week is absolutely chocka-full. We’re gearing up for two big updates: a refresh on the Government’s books at HYEFU on Tuesday, and then the Kiwi economy’s report card for the September quarter on Thursday. Plus, for all our currency enthusiasts, be sure keep an eye out for our FX tactical squeezing in on Wednesday. Phew, that’s a lot! Stick with us as we power through the final stretch of 2025.
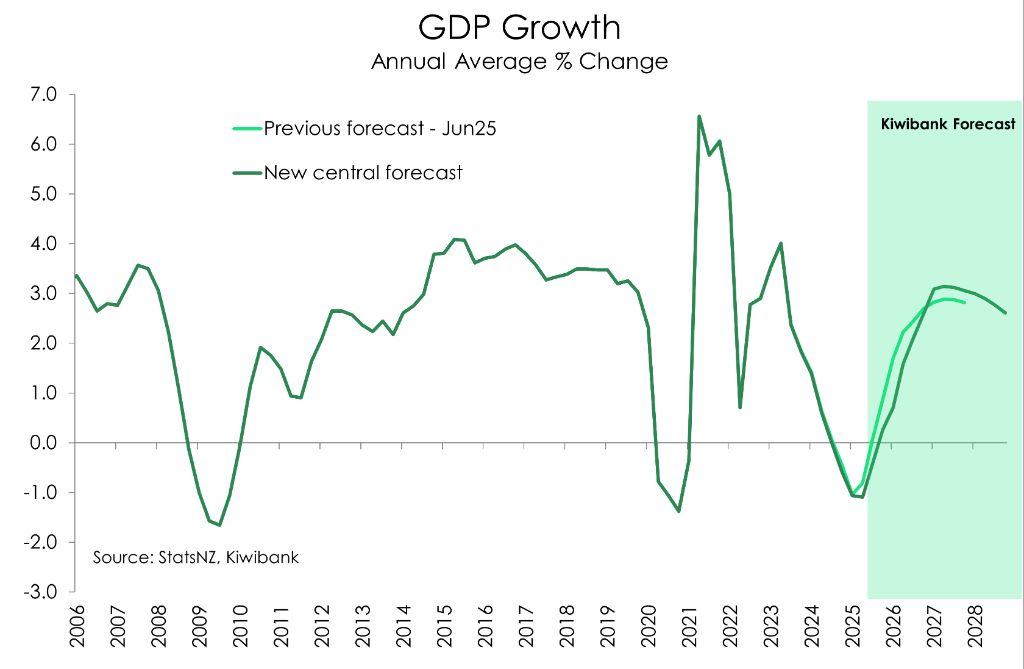
- We’ve just dropped our outlook for 2026. We're seeing markings of a recovery, not just in a few areas, but across the board. From a rebound in household consumption to a stable jobs market, an uptick in house prices and firmer business investment, we have all the ingredients laid out on the kitchen bench for a better year.
- We’re getting lot of questions surrounding the recent lift in retail interest rates. Especially given that they follow a cut from the RBNZ just a few weeks ago. How can that be? We explain in our Special Topic.
Here’s our take on current events
We’re nearing the end of the year. And we’re sprinting to the year. It’s a busy week ahead, book bookended by Treasury’s Half Year Economic and Fiscal Update (HYEFU) on Tuesday and the Q3 Kiwi economic report card (GDP figures) on Thursday. And that’s just local events. Offshore, the data calendar is booked and busy with central bank announcements (ECB, BoE and BoJ) and much-anticipated, but highly volatile US jobs and inflation data (see calendar for more detail). Here at home, HYEFU is up first. The Govt will open its books for all to see, and the question to be answered is will the return to a surplus be delayed yet again?
At the end of the 2025 fiscal year, the Govt’s public finances were in a healthier state than expected. Core Crown tax revenue came in around $800mil more than forecast, while core Crown spending was $525mil less than forecast. Altogether the operating deficit (OBEGALx) was almost $900mil smaller than forecast. A better operating position also left the Govt with a stronger cash position. Although that’s more down to a delay in expected payments, some of which may now take place in the current fiscal year. Nonetheless, the net core Crown debt ended the year at 41.8% of GDP, 0.9%pts below the Budget estimate. The 2026 fiscal year, however, is running slightly behind forecast. For the first four months to October, tax revenue has come in weaker than forecast while spending has been more than forecast. The operating deficit now stands at $4.9bn, around $700mil larger than expected. The forecast horizon will be extended to 2029/30, but we’d expect 2028/29 to still show the return to surplus. The track getting there however may be lowered given the underperformance of tax revenues.
For markets, the focus will be on the bond issuance and fiscal impulse. Consensus is that the issuance should be largely unchanged to what was presented at the Budget, which is $38bn for the 2026 financial year. And Treasury’s fiscal impulse analysis should still conclude fiscal settings as contractionary. That’s a point in favour of keeping the cash rate stimulatory as an offset. Indeed, it’s monetary policy that is currently doing the heavy lifting in strengthening demand and growing the economy.
On Thursday we will see how the Kiwi economy performed over the September quarter. Crunching the numbers, we expect activity lifted 0.9% over the quarter. That would follow June’s 0.9% contraction, and the 0.9% lift back in March. Yes, it does sound like a bit of a roller coaster doesn’t it. The topsy-turvy nature of these quarterly headline numbers reflect ongoing challenges StatsNZ faces with the seasonal balancing item following Covid’s disruption to seasonal patterns. So, take the headline with a grain of salt. And as always brace for revisions. The GDP data is notorious for them. Especially in the September quarter releases which coincide with StatsNZ’s annual benchmarking process and often amplifies revisions. We expect some of June’s near 1% contraction to be revised lower, and if that happens, we could see Thursday’s headline figure look a little weaker than expected too.
Nevertheless, the story beneath the surface points to a quarter of broad-based strength. Most industries should post gains. Professional services are likely to rebound strongly, supported by the rise in hours worked over the quarter. In fact, that’s a tailwind for the wider services sector. Additionally, indicator data over Q3 also point to some meaningful lifts across retail, manufacturing, and construction. Our last two weeklies had covered the lifts in retail sales (up nearly 2%) and building volumes (up 1.5%) over the quarter. Meanwhile PMIs (the activity index for manufacturing) held at expansionary levels throughout Q3.
It all points to a strong quarter of growth. And the outlook from here is looking even brighter. High frequency data for the month of November reflects activity is gathering momentum into the final stretch of the year.
2026 should be an even better year. Our crystal ball told us so. And we’ve updated our forecasts. We continue to forecast a robust recovery for the Kiwi economy. We’re growing in confidence as interest rates have been (belatedly) set at stimulatory levels. And we’re hearing more from investors, after a few years of conspicuous absence. Household budgets are improving, despite the heavy burden of higher prices on essentials. Our card data shows a spreading of consumption into more fun, discretionary spending. That’s a good sign. And business owners are starting to see a lift in activity. It’s not just confidence, it’s action.
Charts of the Week: Bring on the recovery. We’ve updated our forecasts
The Kiwi economy may enjoy a period of above-trend growth. 2025 belonged to the external sector, the likes of agriculture and tourism. It’s an impressive feat considering that the rules of the global playground were being rewritten. But 2026 should be the year that the interest rate sensitive sectors play catch up. Sectors acutely affected by the demand destruction caused by high interest rates stand to gain the most from loose(r) policy settings.
We have all the ingredients laid out on the kitchen bench. A rebound in household consumption – check; a stable jobs market – check; an uptick in house prices – check; and firmer business investment – check. We expect the Kiwi economy to expand around 2.4% next year, and by around 3% in 2027 – if no adverse external shocks come about. Granted, that’s a big if.
With the economic recovery already underway, there are signs that the labour market is stabilising. Filled jobs are crawling higher, and the decline in total hours worked is reversing course. The unemployment rate may be at a nine-year high, but 5.3% should mark the peak. And employment growth should rebound from the middle of 2026, as economic demand strengthens.
The housing market is also set for firmer gains in 2026. Signs of life are already showing. Sales are up 6% compared to October last year. And where sales go, prices follow. Interest rates are the strongest driver of the housing market. However, balanced against ample supply and weak population growth, we expect house prices to rise around 2-3% next year. That’s not exactly shooting the lights out, but it is an improvement from trekking sideways over the last two years.
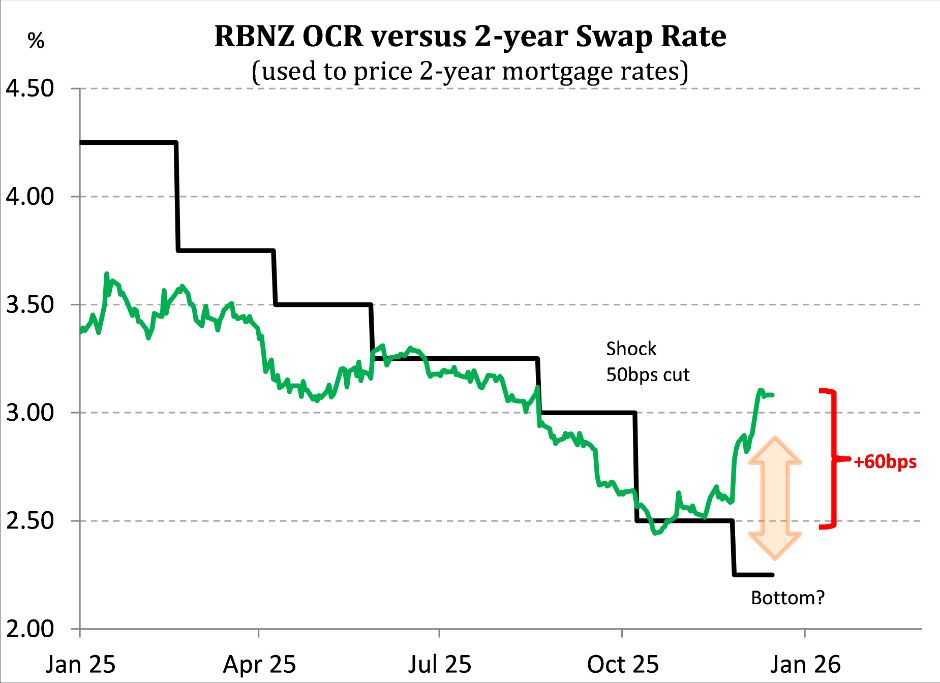
Special Topic: Just like that, the RBNZ have undone the last 75bps of cuts.
Only the RBNZ can cut and hike at the same time. And here they are undoing the last 75bps of rate cuts delivered since October. How can that be? Well, market traders are always looking for the next move… rarely satisfied with the last… and unwilling to price in rates “on hold”. Traders have gone from expecting cuts, to expecting hikes. And we have seen a massive move in wholesale rates. The 2-year swap rate, used by banks to price 2-year mortgage rates, has catapulted higher to 3.08%. That’s a massive 60bps. The 2-year swap rate hit a low of 2.45% in October, following the RBNZ’s surprise 50bp rate cut. Yes, just two months ago the RBNZ was clambering to cut, and in size. Because the economy contracted in the second quarter. And the RBNZ realised (belatedly) that they had more work to do. But here we are today, with higher rates.
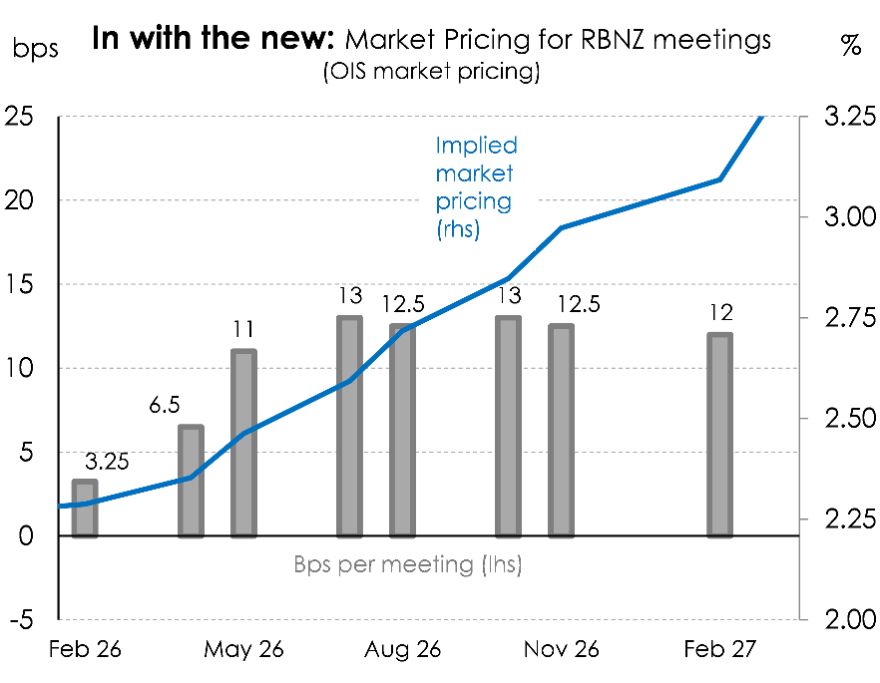
The wholesale market is pricing in hikes from July next year, with a few active bets beforehand. The RBNZ’s OCR track was a little higher than expected, and signalled the RBNZ was close to finished. And that’s all it took. If they’re no longer cutting, then they must be hiking. And wham! Market pricing for the OCR mid-way through next year, has shifted from 2.1% priced just 2 months ago, to 2.5%. But it’s the steepness into 2027 that shows just how overblown the move is. We have a 3.5% cash rate priced in 2027… that’s 125bps of hikes in an economy still operating below potential and with a gaping output gap. In our opinion, wholesale markets have gone too far. And policy relief has barely begun. It’s simply too early to call for hikes, let alone that many.
There is some good news beneath the move higher in interest rates. The outlook for the economy has improved, and the data flow is supportive of an economy in recovery. That’s fine and well. But we are miles away from reversing course and demanding higher rates.
 Google Threat Intelligence Group - GTIG: Google Threat Report Warns AI-Driven Cyber Operations Are Scaling Across Global Threat Landscape
 Commerce Commission: Baseline Research Report On The State Of Competition In New Zealand
 University of Auckland: Junk Food Designed To Make Us Eat More, Study Finds
 Spark: New Report Sets Out Outcomes-Led Approach To Lift Rural Connectivity Using The Right Mix Of Technologies
 Bill Bennett: Fixed Voice Rules Head For Deregulation
 UN Department of Global Communications: United Nations Proposes New Global Dashboard To Measure Progress Beyond GDP