 Scoop has an Ethical Paywall


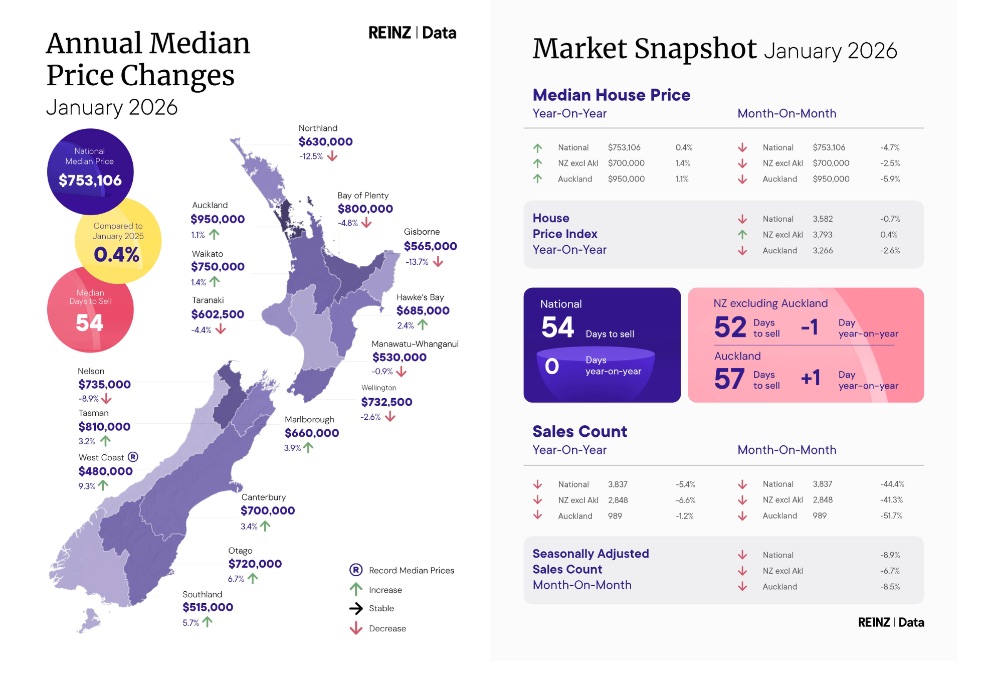
REINZ January 2026 Data: A Stable Market And Steady Prices Underpin A Calmer Property Outlook
The 2026 property market opened the year at a steady pace, shaped by the usual January slowdown, seasonal holiday patterns, and unsettled weather across parts of the country. Latest data from the Real Estate Institute of New Zealand (REINZ) shows median prices holding firm, with national prices rising slightly above January 2025, even as sales counts softened.
National median prices held steady, rising slightly by 0.4% from January 2025 to $753,106. New Zealand, excluding Auckland, rose 1.4% year-on-year, to $700,000. Nine regions saw median prices rise from January 2025, and West Coast recorded a record high of $480,000, up $20,000 from its previous high in October 2025. The national median price for the three months ending January increased 1.4% year-on-year, reinforcing that pricing trends remain steady despite short-term monthly volatility.
“January’s housing market shows stable pricing alongside softer activity, suggesting confidence is rebuilding gradually rather than accelerating quickly,” says REINZ Chief Executive Lizzy Ryley. “This likely reflects a combination of seasonal holiday conditions and unusual, severe weather across parts of the North Island and East Coast. Southern markets in particular showed further signs of strengthening, with regions such as Canterbury, Southland and Otago continuing to show the strongest confidence signals, supported by sustained price growth, tight supply and resilient buyer demand.”
Sales activity across New Zealand declined 5.4% year-on-year, with 3,837 sales reported. Excluding Auckland, sales were down 6.6% to 2,848. Nationally, seasonally adjusted sales counts fell 8.9% compared with December 2025, while in New Zealand, excluding Auckland, sales counts declined 6.7%.
“Interpreting the market over the summer can be challenging, as activity between November and February often reflects seasonal patterns rather than fundamental shifts,” says Ryley. “Once seasonal trends are taken into account, the data shows the January market held up well.”
“Interest rate expectations have stabilised as inflation pressures ease, though there have been some concerns about potential rate increases and what that could mean for borrowing affordability,” says Ryley. “At the same time, the upcoming election may be influencing when people choose to make decisions. In previous election years, we’ve often seen buyers and sellers take a ‘wait and see’ approach early in the year.”
National median Days to Sell was 54 days, much higher than in December 2025 (up 15 days), but this is typical for the time of year. The median Days to Sell figure was the same as in January 2025. Excluding Auckland, this followed a similar trend, with a significant increase compared to last month (up 14 days), but slightly lower than January 2025, down one day to 52.
New listings* increased by 1.3% to 9,019 in New Zealand. New Zealand, excluding Auckland, also recorded an increase, up 0.2% year-on-year to 5,970. National inventory levels* increased by 2.3% from January 2025 to 33,149.
There were five Territorial Authority (TA) records, the first time this has happened since September 2022. These were in the New Plymouth District ($759,000), the Waimakariri District ($770,000), the Ashburton District ($645,000), the Waimate District ($610,000), and the Queenstown-Lakes District ($1,830,000). However, HPI trends indicate that these outcomes were largely driven by an increase in higher-value properties sold, rather than by widespread value growth.
Auction activity remained limited in January, as salespeople noted that auction campaigns typically commence in February. Nationally, there were 251 auction sales in January, accounting for 6.5% of all sales. In New Zealand, excluding Auckland, there were 134 auction sales, accounting for 4.7% of all sales. Auckland saw three fewer auctions than in January 2025, with 117 sales, representing 11.8% of all sales.
“Over the coming months, the housing market is expected to continue progressing gradually, with confidence rising ahead of any increase in transaction activity. While conditions are likely to remain cautious, the outlook suggests momentum building steadily,” says Ryley.
The House Price Index (HPI) for New Zealand is 3,582, a 0.7% decrease over the past year and a 0.6% decrease month-on-month. However, the index level is still 16.2% below its peak. Over the past five years, New Zealand's average annual HPI compound growth rate has been 0.6%.
*Inventory and Listings data courtesy of realestate.co.nz
Notes:
Fact sheet
National Highlights for January
- The total number of properties sold in New Zealand decreased by 5.4% year-on-year, from 4,058 to 3,837 sales. New Zealand, excluding Auckland, saw a decline of 6.6% year-on-year, from 3,050 to 2,848.
- Nationally, the seasonally adjusted figures for New Zealand show a sales count decrease of 8.9% compared to last month. Seasonally adjusted sales figures for New Zealand, excluding Auckland, show a 6.7% month-on-month decrease.
- Listings* nationwide increased by 1.3% year-on-year, reaching 9,019 new listings in January. New Zealand, excluding Auckland, saw a slight rise of 0.2% year-on-year, reaching 5,970 new listings.
- The median Days to Sell for New Zealand was the same as in January 2025 at 54 days. The median Days to Sell for New Zealand, excluding Auckland, decreased by one day, to 52 days.
Regional Highlights for January
- West Coast recorded its highest median price at $480,000, up $20,000 compared to its previous record in October 2025.
- Four regions
recorded an increase in sales compared to January 2025
o Northland, up 4.3% to 122 sales
o Taranaki, up 13.4% to 127 sales
o Wellington, up 0.6% to 355 sales
o Otago, up 2.9% to 250 sales
More information on activity by region can be found in the regional commentaries on the REINZ's Website.
Median Prices
- Nine of the sixteen regions recorded a year-on-year rise in the median price, with the West Coast showing the strongest growth at 9.3%.
- Across Auckland’s seven territorial authorities, four recorded an increase compared with January 2025, with Auckland City showing the largest lift at 8.7%.
- In Wellington, three of the eight territorial authorities saw an annual increase, led by South Wairarapa District at 5.2%.
- West Coast reached a new all-time regional median price record this month; $480,000 which beat the previous high of $460,000 recorded in October 2025.
- Five new territorial-authority records were set across New Zealand, three of them (Ashburton, Waimakariri and Waimate) within the Canterbury region.
Sales Counts
For all months
- New Zealand, NZ excl. Auckland, Bay of Plenty, Canterbury, Gisborne, Hawke's Bay, Manawatu-Whanganui and Waikato had their lowest sales count since January 2024. For Gisborne, it was the pandemic that affected April 2020, when there were fewer sales in a month than there were this month.
For the month of January
- Gisborne had its equal lowest number of sales recorded in a January month, with January 2024 also resulting in 14 sales.
- Otago had its highest number of sales for the month of January since 2019
- Wellington had its highest number of sales for the month of January since 2020
- Northland and Taranaki had their highest number of sales for the month of January since 2021
Median Days to Sell
For all months
- Wellington had its highest median Days to Sell since February 2023
- The last time the median Days to Sell in Auckland was as high was in February 2023, and it was May 2020 when it was last higher
- Tasman had its highest median Days to Sell since September 2024
- West Coast had its lowest median Days to Sell since November 2024
For the month of January
- Auckland had its highest median Days to Sell since 2001
- Auckland had its highest median Days to Sell since 2009
- Marlborough had its highest median Days to Sell since 2012
House Price Index (HPI)
- Southland recorded the strongest HPI movement year on year, increasing 11.9%, ahead of Otago (4.7%) and Canterbury (2.8%). Southland has held the top annual ranking for the past six months, and in 19 of the past 22 months.
- Over the three months to January, Southland showed the highest HPI growth nationwide, followed by Otago and Taranaki.
- New Zealand HPI YOY change remained slightly negative at -1.2%
Inventory*
- Inventory increased year on year in nine of the fifteen included regions
- Auckland and Wellington have each experienced 24 consecutive months of year-on-year inventory growth
- West Coast has recorded 20 consecutive months of inventory increases
- Manawatu-Whanganui has recorded an increase in inventory compared to January 2025 ending a nine-month run of YOY inventory decreases
Listings*
- New listings increased year on year in nine of the fifteen included regions.
- Gisborne showed the strongest annual growth in listings, rising 45.1% on the same month last year.
Auctions
- In New Zealand, there were 251 auction sales (6.5% of all sales) in January 2026. In January 2025, there were 267 auction sales (6.6% of all sales).
*Inventory and Listings data courtesy of realestate.co.nz
 Bill Bennett: Fixed Voice Rules Head For Deregulation
 UN Department of Global Communications: United Nations Proposes New Global Dashboard To Measure Progress Beyond GDP
 Banking Ombudsman Scheme: Fraud Check Delays Well Worth The Inconvenience, Says Banking Ombudsman
 Asia Pacific AML: NZ’s Financial Crime Gap - Beyond The 'Number 8 Wire' Mentality
 Westpac New Zealand: Kiwi Households Adapting Despite Widespread Cost Pressure Concerns, Westpac Survey Shows
 University of Auckland: Kids’ Screen Use Linked To Long-Term Deficits In Self-Control And Attention