 Scoop has an Ethical Paywall


Arrowtown Crowned Aotearoa’s Most Expensive Suburb As National Market Stabilises
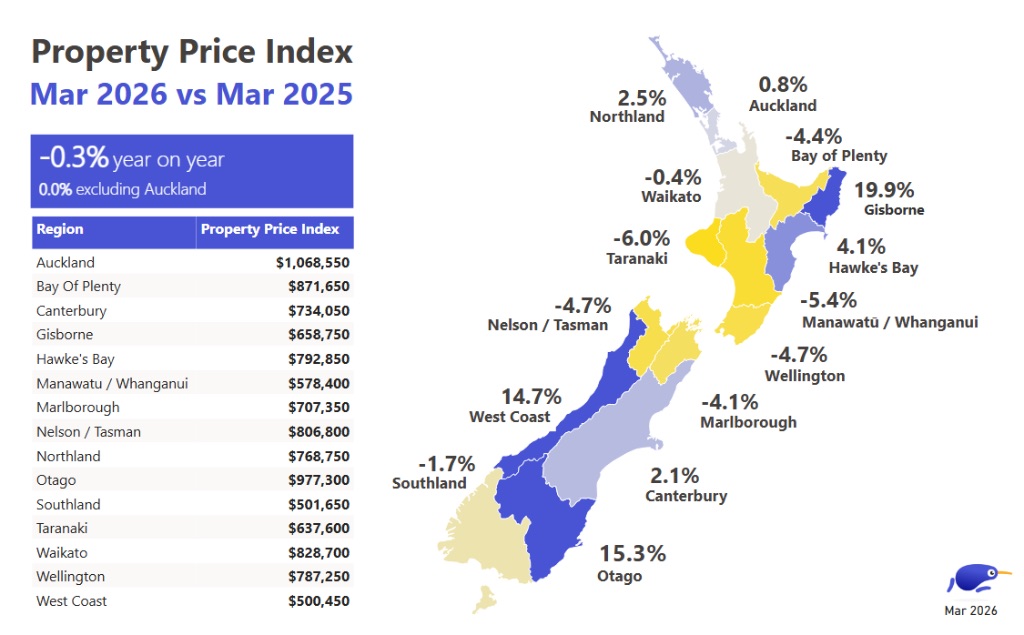
New Zealand’s property market continues to show a ‘wait and see’ approach as national asking prices dipped slightly in March, while a new leaderboard of the country’s most expensive postcodes reveals a shift in luxury demand toward the South Island.
Trade Me’s Property Pulse Report shows the national average asking price sat at $862,550 in March, flat (0.3%) year-on-year and down 2.5 per cent from February.
The golden postcodes
While the national average cooled, the top end of the market is heating up.
New data from the first three months of the year reveals the suburbs that are leading the charge in property values, with Arrowtown claiming the early title of the most expensive with an average asking price in 2026 of more than $3 million dollars.
The Central Otago hotspot is followed by Tāmaki Makaurau’s Parnell ($2,640,350) and Westmere ($2,598,900), which makes its top three debut. Former frontrunner Remuera ($2,378,500) has slipped to fourth position, while Ponsonby ($2,300,650) rounds out the top five of the year to date.
Trade Me Property Customer Director Gavin Lloyd says the rise of Arrowtown reflects a broader trend of premium lifestyle-seeking among Kiwi buyers.
"Arrowtown hitting the $3 million mark is a massive milestone. It’s no longer just a holiday destination, it’s fast becoming a status postcode for those looking for a mix of heritage charm and alpine luxury," said Lloyd.
"While Auckland still dominates 15 of the top 20 most expensive spots, the South Island is making its presence felt with Arrowtown, Wānaka, Queenstown and Christchurch’s Fendalton all firmly in the multi million-dollar club".
Regional highlights and inventory
The March data shows a surge in activity as Kiwi head into autumn.
New listings across the country are up 2 per cent from February, and buyer demand also remains resilient, with search activity up 5 per cent month-on-month.
"We are seeing a fairly balanced market right now," Lloyd added.
"Supply is up, but so is demand. It’s a great time for buyers who have been sitting on the sidelines, as they have more choice than they did a year ago, particularly in regions such as Otago and Southland where new listings have jumped by 14 per cent and 15 per cent respectively".
Notes:
Top 20 most expensive suburbs in New Zealand for Jan–Mar 2026
The data reflects the Property Price Index for January, February, and March 2026. The analysis is based on the following filters: Suburbs with 30 or more live listings and property category is 'Residential For Sale' or 'New Homes'.
| Suburb | Property Price Index |
| 1. Arrowtown, Queenstown-Lakes | $3,026,200 |
| 2. Parnell, Auckland City | $2,640,350 |
| 3. Westmere, Auckland City | $2,598,900 |
| 4. Remuera, Auckland City | $2,378,500 |
| 5. Ponsonby, Auckland City | $2,300,650 |
| 6. Devonport, North Shore City | $2,139,750 |
| 7. Saint Heliers, Auckland City | $2,055,450 |
| 8. Kohimarama, Auckland City | $2,028,800 |
| 9. Ōrākei, Auckland City | $2,028,400 |
| 10. Mission Bay, Auckland City | $2,005,400 |
| 11. Wānaka, Wānaka | $1,974,350 |
| 12. Glendowie, Auckland City | $1,973,350 |
| 13. Town Centre, Queenstown-Lakes | $1,972,200 |
| 14. Epsom, Auckland City | $1,854,600 |
| 15. Greenhithe, North Shore City | $1,846,500 |
| 16. Riverhead, Rodney | $1,839,950 |
| 17. Fendalton, Christchurch City | $1,824,200 |
| 18. Takapuna, North Shore City | $1,791,850 |
| 19. Freemans Bay, Auckland City | $1,784,950 |
| 20. Oneroa, Waiheke Island | $1,761,050 |
About the Trade Me Property Pulse Report:
- The Trade Me Property Pulse Report measures trends in the expectations of selling prices for residential property listings added to Trade Me Property by real estate agents and private sellers over the past months.
- It provides buyers, sellers and realtors with insights into ‘for sale’ price trends by property type and property size.
- The Index is produced from data on properties listed on Trade Me Property in the past month. The Index uses an “80 per cent truncated mean” of the estimated property value to calculate the average asking price. This excludes the upper and lower 10 per cent of listings by price, and averages the expected sale prices of the remaining properties.
- It provides an insight into ‘for sale’ price trends by type and size of property. Other reports aggregate property price data across these various properties.
- Some of the numbers in this release have been rounded.
 University of Auckland: Kids’ Screen Use Linked To Long-Term Deficits In Self-Control And Attention
 University of Auckland: Research To Address Equity In STEM For Māori, Pacific And Female Students
 Stats NZ: Economic Impacts On New Zealand From Conflict In The Middle East – Report
 Advertising Standards Authority: ASA Annual Report 2025 - Platform-Neutral Regulation Keeps Pace With Digital Advertising
 Science Media Centre: Lead Pipes Banned For New Plumbing – Expert Reaction
 New Zealand Young Physicists Trust: Auckland To Host The ‘World Cup Of Physics’ In 2027; Search Begins For Student-Designed Tournament Logo