 Scoop has an Ethical Paywall


Housing market stable through holidays and wild weather
NEWS RELEASE 12 May 2017
Housing market stable through holidays and wild weather
After record national median prices in March, prices are stable and sales volumes fell across New Zealand during April as the market moved past the traditional March peak and into a typical cyclical April, according to the latest figures released today by REINZ, source of the most recent, complete and accurate real estate data in New Zealand.
On a seasonally adjusted basis the national median price rose 1% indicating that the decline in the national median price for April was less than expected for this time of year.
This is further confirmed by the REINZ House Price Index (HPI) of market activity levels, which was launched last month. Month-on-month activity nationwide was up 0.4%, Auckland up 0.2% and outside Auckland up 0.8%, indicating stable market activity. Over the last three months, nationwide activity was up 1.4%, in Auckland up 0.8%, and outside Auckland up 2.5%
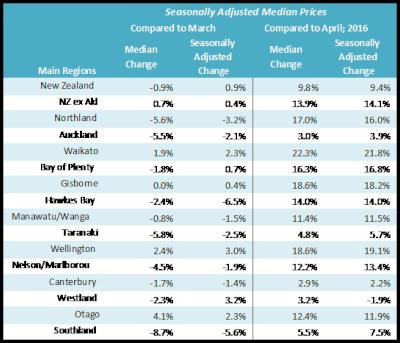
Three regions hit new record high median sale prices in April 2017 as the national median price rose 10.4% to $540,000 year-on-year. Regions seeing record median prices were Waikato (up 22.3% year-on-year to $489,200), Wellington (up 18.8% year-on-year to $537,000) and Otago (up 12.7% to year-on-year to $381,000).
The number of sales for April 2017 was 5,845, a seasonally adjusted drop of 9% compared to March. Year-on-year, sales volumes declined 31%, reflecting impacts on market activity such as the combination of an exceptionally wet April plus school holidays, Easter and ANZAC Day.
KEY DATA SUMMARY:
| National median house price year-on-year | National National ex Auckland Auckland | $540,000 - up from $489,000
+10.4% year-on-year $435,000 - up from $382,500 +13.7% year-on-year $854,500 - up from $830,000 +3.0% year-on-year |
| Seasonally adjusted median house price | National National ex-Auckland Auckland | Up 0.9% on March Up 0.4% on March Down 2.1% on March |
| Month-on-month median house price | National National ex-Auckland Auckland | $540,000 – down 0.5% on
March: $542,500 $435,000 – up 0.8% on March: $431,500 $854,500 – down 5.6% on March: $905,000 |
| Median days to sell | National Auckland | 34 – two
days longer compared to April 2016 35 – three days longer compared to April 2016 |
| House Price Index | National National ex-Auckland Auckland | 2,690 – up 7.8% on April
2016 2,386 – up 12.8% on April 2016 2,901 – up 5.2% on April 2016 |
Real Estate Institute of New Zealand (REINZ) CEO Bindi Norwell says: “The data for April shows that the market is reasonably stable, despite the impact of a number of factors on activity right across New Zealand. These include severe weather in April - one of the wettest on record - and the combination of Easter (which fell in March last year), plus school holidays and ANZAC Day. Anecdotal evidence suggests that in some regions this was the dominant feature of the month. Importantly though, the overall tone of the market remains broadly positive, with price and sales volume drops broadly typical in April.
“The Auckland region has seen a continued increase in the level of inventory with almost 2,500 more homes for sale in April compared to 12 months ago and the number of weeks of inventory now the third highest in the country. Auckland’s median price increased by 3% since April 2016, which suggests that Auckland is further through the property market cycle than the rest of New Zealand, which continues to see strong sales volume and price growth and an accompanying decline in inventory levels.”
Inventory up in Auckland, down everywhere else
The number of properties available for sale continues to decline nationwide, with 1,028 fewer houses for sale in April compared to 12 months ago, although the number of properties for sale in the Auckland region has increased by 2,468 (+39%). Compared to April 2016 the number of listings fell 3.2% in Canterbury, 13.2% in Wellington and 12% in Waikato. Excluding Auckland, the number of properties for sale has fallen by 3,496 (-16.7%) over the past 12 months.
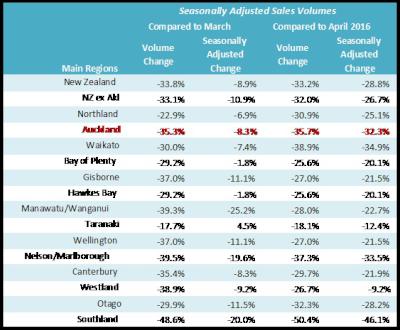
Sales volumes drop
There were 5,845 unconditional residential sales in April, representing a 32% decline on March and a 31% decline on April 2016. On a seasonally adjusted basis, the number of sales fell 9% from March to April.
Median prices firm, continuing to be led by the regions
The national median house price rose $51,000 (+10.4%) year-on-year. Compared to March the national median house price eased $2,500 (-0.5%). Gisborne and Nelson/Marlborough recorded the largest percentage increase in median price compared to April 2016, at 23%, followed by Waikato at 22.3% and Wellington at 18.8%.
Days to sell moving higher
The number of days to sell eased by one day to 34 days from March, and eased two days compared to April 2016. Otago had the shortest days to sell at 26 days, followed by four regions at 27 days (Gisborne, Manawatu-Whanganui, Wellington and Otago) followed by Nelson/Marlborough at 28 days. Taranaki had the longest number of days to sell at 44 days, while in Auckland the number of days to sell was steady at 35 days compared to March, up three days to 35 days compared to April 2016.
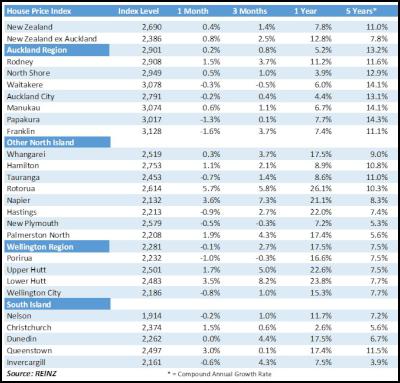
HPI shows stable market
The REINZ HPI indicates that activity nationwide year-on-year has lifted 7.8%, up in Auckland by 5.2% and outside Auckland by 12.8%. Month-on-month activity nationwide was up 0.4%, Auckland up 0.2% and outside Auckland up 0.8%, indicating stable market activity.
Already being used by the Reserve Bank’s forecasting and macro financial teams, plus the major banks, the REINZ HPI provides a new level of detail and understanding of the true movements of housing values over time. It does this by analysing how prices in a market are influenced by a range of attributes such as land area, floor area, number of bedrooms etc. to create a single, more accurate measure of housing activity and trends over time. Using the Reserve Bank’s preferred Sale Price to Appraisal Ratio (SPAR) methodology, the REINZ HPI uses unconditional sales data (when the price is agreed) rather than at settlement, which can often be weeks later. It is therefore more accurate and timely.
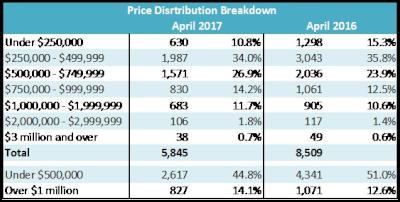
Million dollar homes show largest increase in volumes
Between April 2016 and April 2017, the number of homes sold for more than $1 million fell by 23% to 826 homes to equal 14% of all dwellings sold. The number of dwellings sold under $500,000 has declined by 1,714 between April 2016 and April 2017.
For regional commentary and tables, please see the accompanying report.
Monthly_Property_Report__April_datal.pdf
- ENDS -
Note to Editors:
The monthly REINZ residential sales reports remain the most recent, complete and accurate statistics on house prices and sales in New Zealand. They are based on actual sales reported by real estate agents. These sales are taken as of the date that a transaction becomes unconditional, up to 5:00pm on the last business day of the month. Other surveys of the residential property market are based on information from Territorial Authorities regarding settlement and the receipt of documents by the relevant Territorial Authority from a solicitor. As such, this information involves a lag of four to six weeks before the sale is recorded.
*Seasonal adjustment is a statistical technique that attempts to measure and remove the influences of predictable seasonal patterns to reveal how the market changes over time.
Further Data:
Across New Zealand the total value of residential sales, excluding sections, was $3.849 billion in April 2017, compared to $5.202 billion in April 2016 and $5.805 billion in March. For the 12 months ended April 2017 the total value of residential sales was $53.447 billion. The breakdown of the value of properties sold in April 2017 compared to April 2016 is:
Seasonally Adjusted Sales Volumes
Seasonally Adjusted Median Price
House Price Index Data
 UN Department of Global Communications: United Nations Proposes New Global Dashboard To Measure Progress Beyond GDP
 Banking Ombudsman Scheme: Fraud Check Delays Well Worth The Inconvenience, Says Banking Ombudsman
 Asia Pacific AML: NZ’s Financial Crime Gap - Beyond The 'Number 8 Wire' Mentality
 Westpac New Zealand: Kiwi Households Adapting Despite Widespread Cost Pressure Concerns, Westpac Survey Shows
 University of Auckland: Kids’ Screen Use Linked To Long-Term Deficits In Self-Control And Attention
 University of Auckland: Research To Address Equity In STEM For Māori, Pacific And Female Students